Bitcoin Trading : BTC/USD Technical Analysis – 29th June 2014

Sunday, 29/06/2014 | 17:26 GMT by Ashton Fraser
Bitcoin Trading : BTC/USD Technical Analysis – 29th June 2014

Analysis provided by Ashton Fraser, learn more about his trading strategies at the Lasers forex forum.

As another week comes to a close, Bitcoin has returned back to the levels it reached at the end of last week, as the support we spoke about has stayed firm.

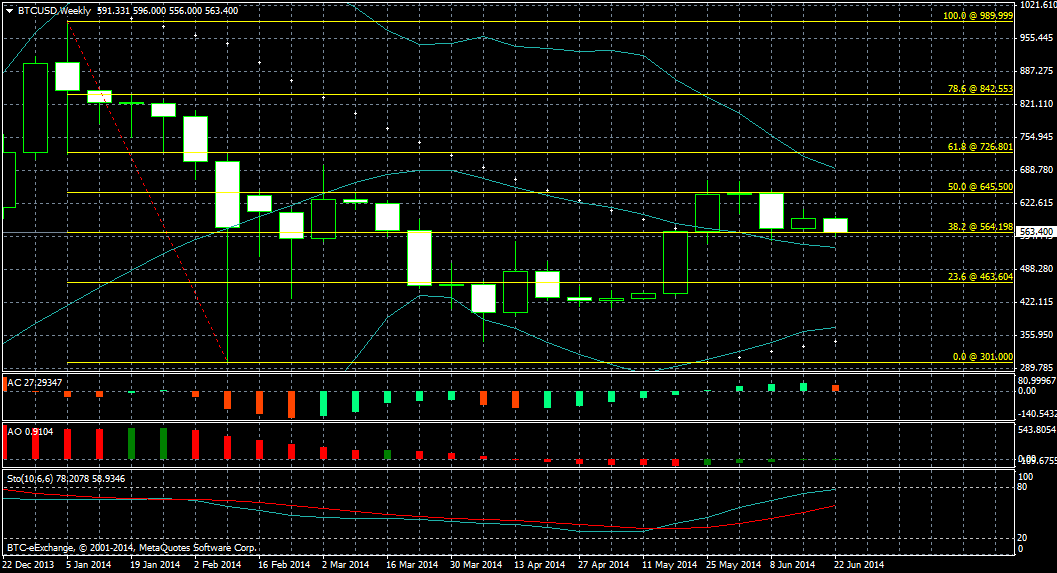
During midweek, I posted the following BTC/USD Weekly chart:
btcusdweekly_25_06_2014

Where I mentioned, "It's the strong support at the 38.2% Fibonacci retracement level at 565 that is keeping price from sliding down any further for now... making it likely for there to be further ranging for the rest of the week."

Unsurprisingly, the next day, Bitcoin bulls came into effect, as the 38.2% Fib support proved too strong. This has been a recurring theme over the past few weeks, and it seems it could go on, for some time yet. Perhaps this current period of consolidation can be explained by the World Cup in Brazil. Bitcoin to the moon after the World Cup final anyone?

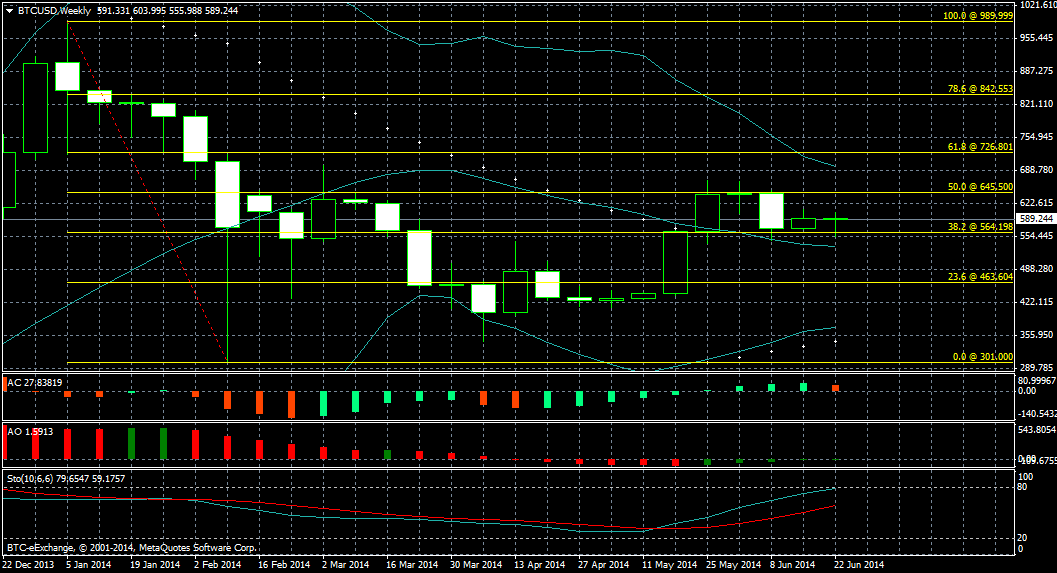
On a more serious note, we can see the technicals in play by way of the latest BTC/USD Weekly chart below, whilst applying the same Fibonacci study, i.e. from the high of this year at 1000, until the low of this year at 300:
btcusdweekly_29_06_2014

As can be seen, as of writing, price is hovering around 590, which marks two levels.

1. The close of last week (see chart above), resulting in the formation of a doji for this week's candlestick.

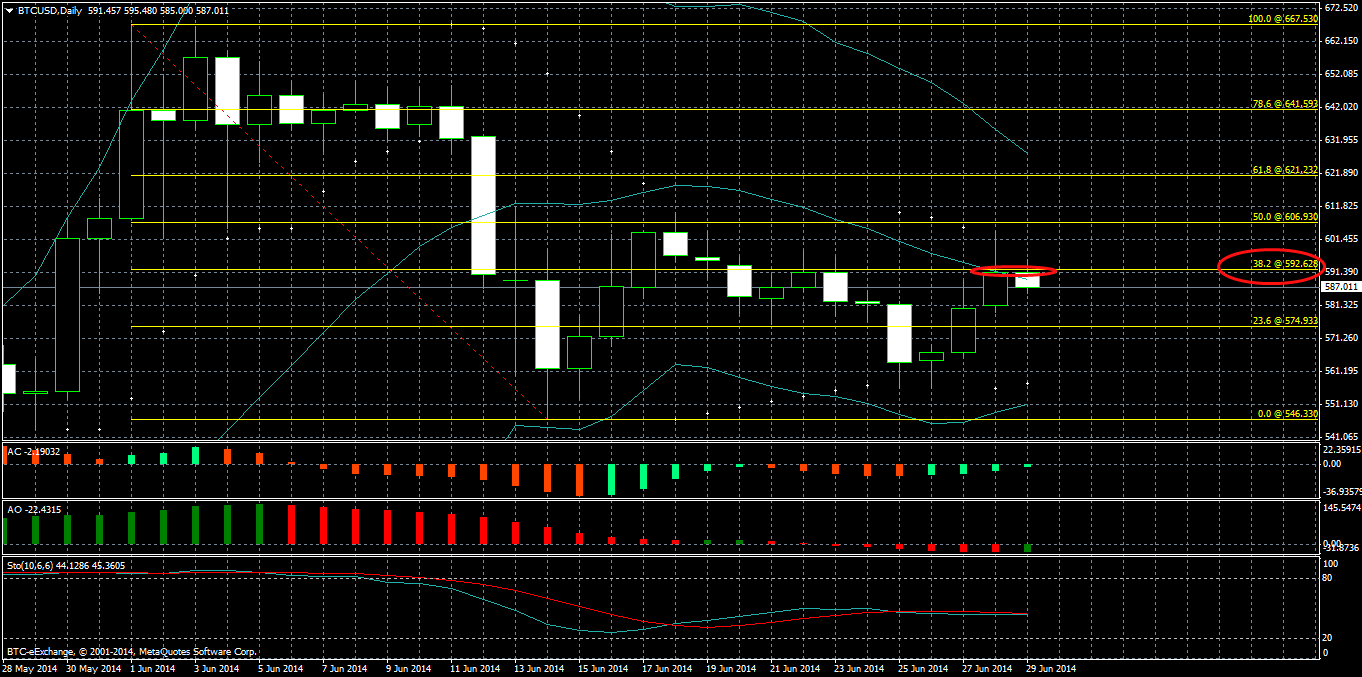
2. If we zoom into the Daily chart, we'll notice 590 is also the 38.2% Fib level, once we perform a study from the high of this month until the low of this month, marked in red (see chart below):
btcusddaily_29_06_2014

It's also interesting to note that the Bollinger Bands are now converging, (the lower band heading up and the upper band heading down), and I fear this could continue into a Bollinger squeeze, similar to what we saw during the middle of last month. Even the Stochastics are now literally in a horizontal motion, further evidence of ranging. I can't see much changing this coming week.

Learn more at https://www.forexlasers.com

About the Author: Ashton Fraser
Ashton Fraser
  • 290 Articles

More from the Author

CryptoCurrency