Analysis provided by Ashton Fraser, learn more about his trading strategies at the Lasers forex forum.
The past week saw Bitcoin continue its, by now, almost predictable sine wave motions, heading north, only for the bulls to be restricted by a familiar foe, in the form of the ever present 50% resistance zone from the Weekly chart.
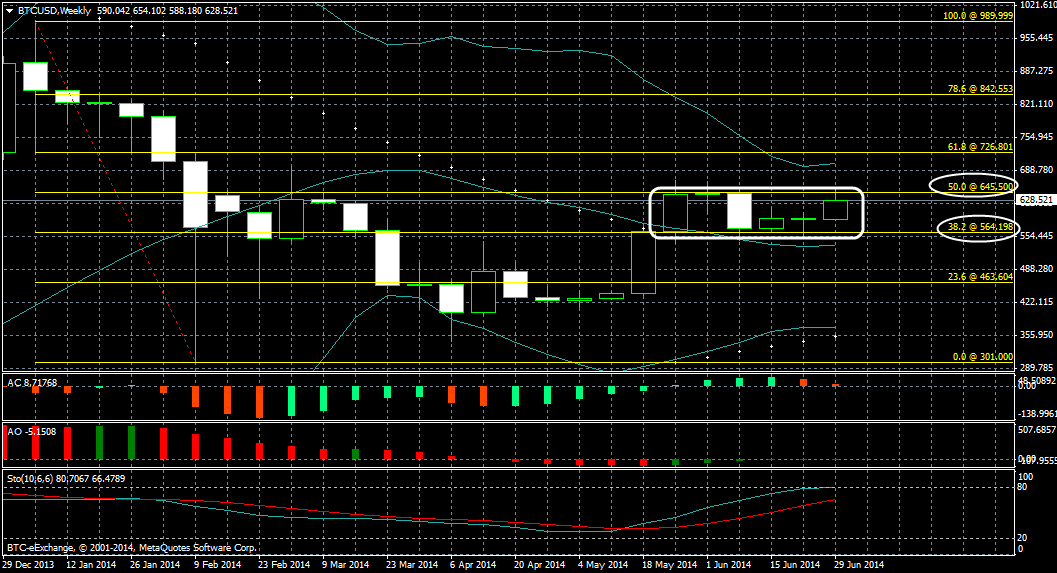
Let's take a closer look at the current BTC/USD Weekly chart below (click to expand):

Again, performing the Fibonacci study, i.e. from the high of this year at 1000, until the low of this year at 300. Just take a look at that almost perfect conformity to the Fibonacci lines, marked in white. Price has been fluctuating between the 50% at 650 and the 38.2% at 545 for several weeks. Indeed, what I mentioned last week remains true, in that this pattern has "been a recurring theme over the past few weeks, and it seems it could go on, for some time yet", I just can't see the status quo being broken any time soon - it will probably take some major fundamental piece of news to send shockwaves to these technicals.
Right now however, there seems to be an internal consolidation in play, if we zoom into the daily timeframe (click chart to expand):

Before we analyse the ranging from the start of this month, it's interesting to note that this upwards surge on the 30th of June occurred when so many bullish indicators aligned, with the Awesome and Accelerator Oscillators turning green, along with the Parabolic SAR dots beneath the candles (marked in a green ellipse). Concerning the ranging throughout July thus far, of we perform our shorter term Fib study from the high of last month until the low of last month, then we can see how since the start of this month, there has been some messy, somewhat staggered ranging with bearish undertones, between the two Fib levels of 78.6% at 641 and 61.8% at 621, marked in blue. In my opinion the 78.6% Fib level is arguably the most underrated of all the Fibonacci retracements; it often proves to be a consistent zone of support and resistance, it's definitely a valuable tool in a trader's arsenal.
Moving back to our first chart above (on the weekly), check out how all three Bollinger Bands are now moving in a horizontal motion. This, in conjunction with the fact that both the AC and the AO have turned red, tells me we're likely to see a bounce off the 50%, with the bears taking temporary control.
Learn more at https://www.forexlasers.com


