BTC/USD Technical Analysis – 1st June 2014

Sunday, 01/06/2014 | 18:27 GMT by Ashton Fraser
BTC/USD Technical Analysis – 1st June 2014

Since my last analysis on Bitcoin last week, the resistance I spoke about has been broken with aplomb, and it seems we could see a further rise to around 725 fairly soon, with some very strong bullish technicals on show.

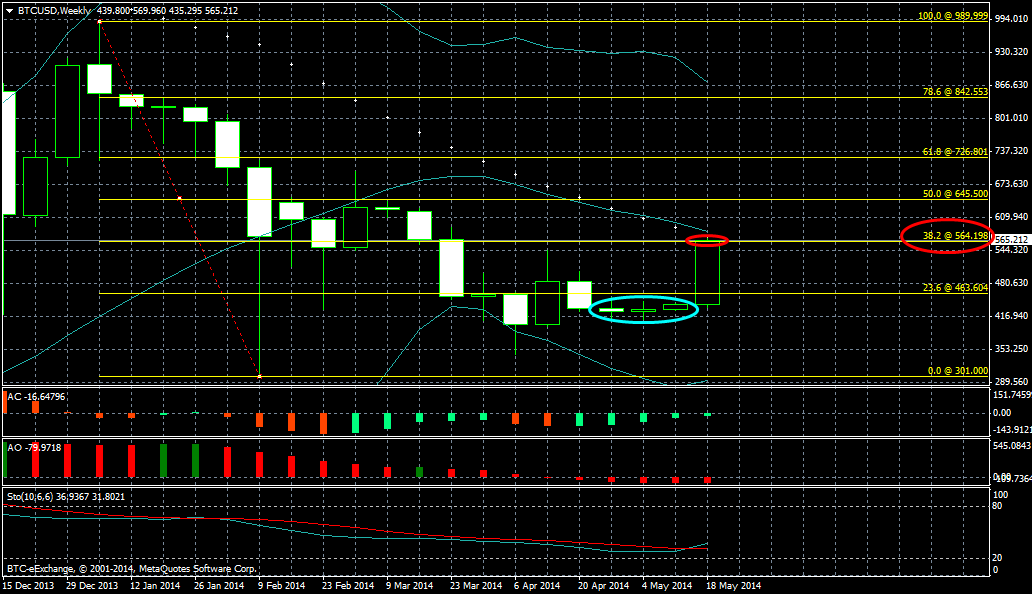
Last week we posted the following chart (click to expand):
btcusdweekly_25_05_2014

Where I highlighted in a blue ellipse some classic candlestick technicals alluding to a potential reversal, mentioning, "Check out the three candlesticks marked in blue, which corresponds to the period from the 27th of March until the 17th of May. Notice how they are all exceedingly small candles; with the first two being typical spinning tops. Such types of price action, i.e. multiple consecutive spinning tops and dojis can often indicate a trend reversal, and whilst on its own it's not enough, there are other bullish technicals, most prominently the Accelerator Oscillator which has turned green for a number of candles." Indeed, since then, we've had even more corroboration of technicals leading to a virtually inevitable hike, breaking the 38.2% Fib.

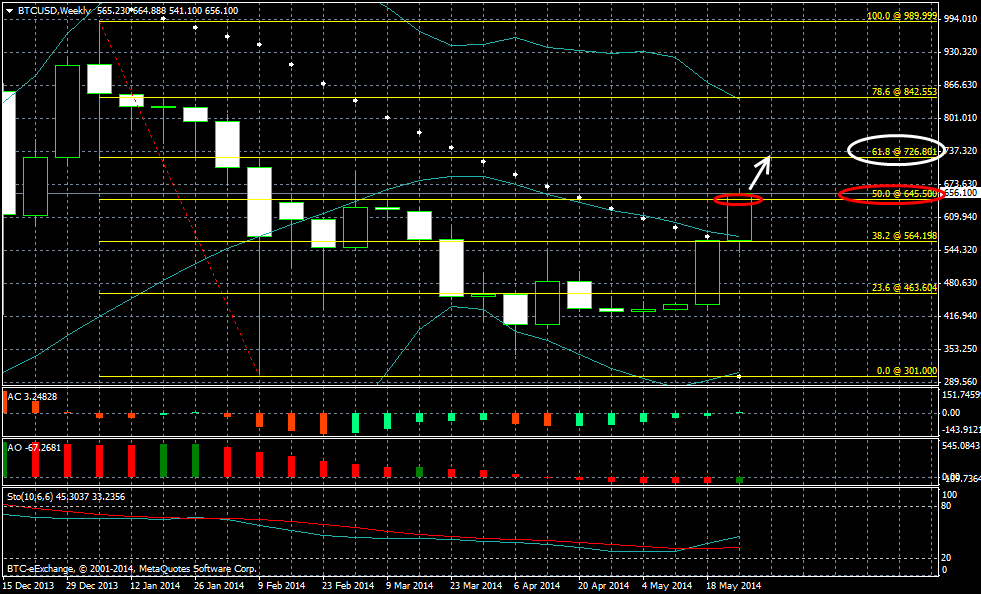
Now, let's take a closer look at the latest BTC/USD chart on the Weekly timeframe (click below to expand):
btcusdweekly_01_06_2014

Again, I’ve applied the Fibonacci study to the high and low of this year, which are actually two very powerful psychological whole numbers, i.e. from the swing high of 1000 during the first week of 2014, until the low at 300, during early February.

What jumps out at us is the perfect closure near the end of last week, at the 38.2% Fib retracement level at 565. And over this weekend, the bulls have just continued to surge forth, currently hovering around the 50% mark at 650, (marked in red), as we predicted earlier this morning, where, in addition to the Stochastics heading north and the Accelerator Oscillator turning green some weeks ago, we've just seen (as in today), the Awesome Oscillator also turn green, giving me added confidence in a rise to the next key Fib retracement level, i.e. the 61.8% Fib level at 725, marked in white, sooner rather than later, provided price closes above the current (seemingly feeble) resistance at 50% on the Daily timeframe, which would confirm a definite break thus potentially setting the tone for the rest of the week.

About the Author: Ashton Fraser
Ashton Fraser
  • 290 Articles

More from the Author

CryptoCurrency