Clive Lambert MSTA MCSI is chief technical analyst at FuturesTechs, a UK-based independent technical analysis company covering Equities , bonds, commodities and Forex . FuturesTechs was established in 2000 and was awarded Independent Research House of the Year at the 2014 Technical Analyst Awards.He is a former LIFFE Floor broker and the author of “Candlestick Charts.” You can connect with him on LinkedIn or Twitter.
GBP/USD has been in a solid downward trend for months now. It was trading above 1.7000 in July, but has recently dipped below 1.5000 before staging a tentative recovery. So is that the end of the sell off?
Let’s look at the charts to try and decide the answer to this question.
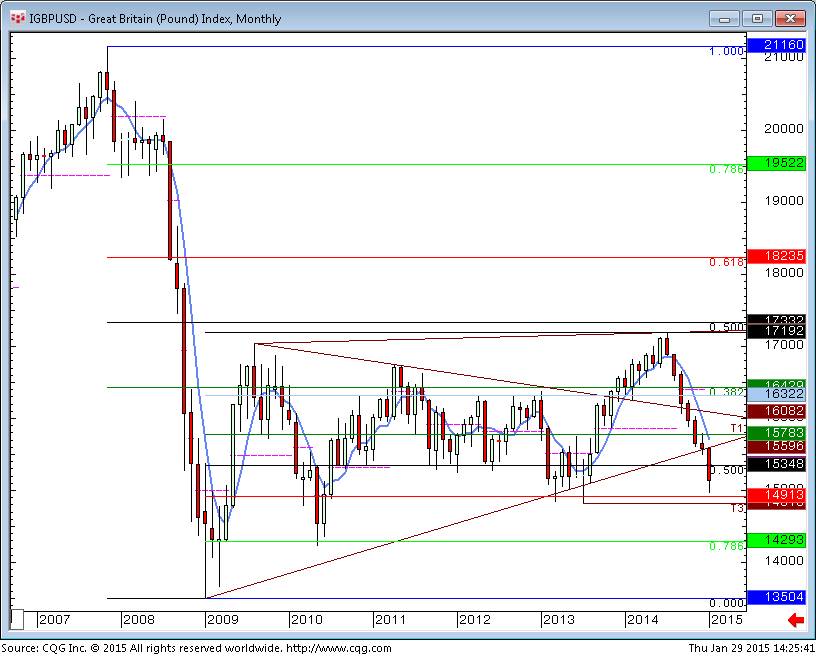
When analysing the charts an approach I’ve always advocated is starting with the “bigger picture” then moving down to the shorter term timeframes. So the first chart is the Monthly.

This shows that January saw a break of a gently sloping uptrend support line that was sitting at 1.5600. We saw a solid reaction to this break, clearly. But the other thing it shows is that 1.5000 is nothing more than a “round number”, and that we have far more important support levels a bit lower than here, at 1.4813-32, where we saw two lows back in March and July 2013.
This also coincides with the 61.8% Fibonacci retracement of the gains seen between January 2009 and last July’s high. These Fibonacci levels can often have a say and you should ignore them at your peril, especially if, like here, they coincide with old support or resistance levels.
So the monthly says, “Bearish but with support below".
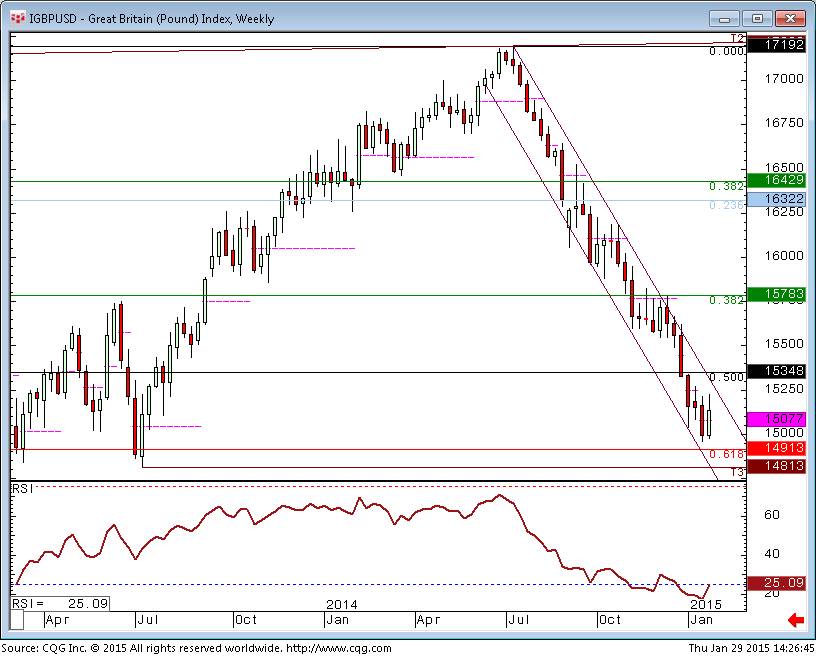
To the Weekly chart. This shows a channel that has been pretty good at defining the weakness since July, and we’re still in this channel. The top line is at 1.5310. IF we saw a close above 1.5160 this week we would post a “Bullish Engulfing Pattern”, a powerful reversal in candlestick analysis. But this is an “if” for now as the close is key to candlestick formations. The RSI (Relative Strength Indicator) momentum study has read as low as 17 last week, but is trying to recover as well.

So the weekly says, “Trying hard, but needs to get above 1.5310” to take out the channel top line.
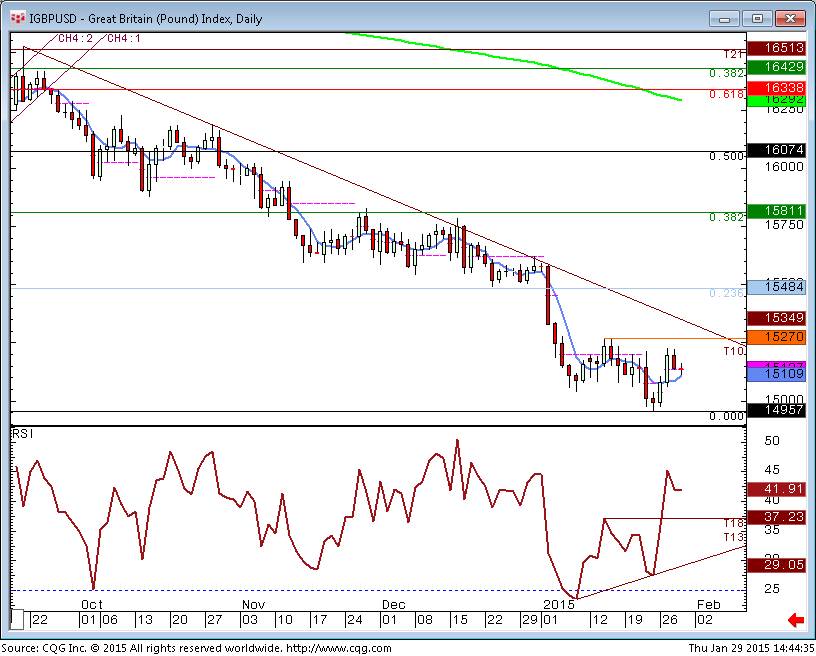
Which brings us to the daily chart: The RSI on this timeframe has already given a “Bottom Failure Swing” buy signal, but price is yet to add weight to this, needing to take out the last lower high at 1.5270 to agree. The trendline on this chart sits at 1.5349.

Trying to bring all of that together we can summarize as follows:
• We are still in a downtrend
• Shorter term there are signs that we have bottomed out but…
• …we need further confirmation, which will come in the shape of a move through 1.5310-50.
• If/when 1.5310-50 is taken out, the first upside target will be 1.5500, then 1.5800.
• Sellers are likely to return at one of these.
This article is part of the Forex Magnates Community project. If you wish to become a guest contributor, please get in touch with our Community Manager and UGC Editor Leah Grantz leahg@forexmagnates.com


