Semi-Annual North America FX Volume Survey: Electronic Trading Rises Further

Wednesday, 30/07/2014 | 18:33 GMT by Victor Golovtchenko
  • Results from the latest semi-annual North America survey show 43% of all transactions are spot FX, 29% swaps, while electronic trading now accounts for more than half of all deals as of April this year.
Semi-Annual North America FX Volume Survey: Electronic Trading Rises Further

The newest volumes of The Foreign Exchange Committee’s semi-annual Survey of North American Foreign Exchange Volume has been released this week and the results represent a thorough picture of the state of the foreign exchange market. In April 2014, twenty five major institutions contributed to the research piece unveiling the latest trends in the foreign exchange industry.

There are four categories representing the data points with customer, product, currency pair and Execution sets. Survey data is broken into four FX instruments, thirteen currency pairs, four counterparty types and five execution method categories. For the sake of convenience we have ignored the data from the Argentinian peso, as recent tumultuous developments and the near-default of the country have brought trading volumes in that currency to a halt.
FX Trading Volumes by Currency pair

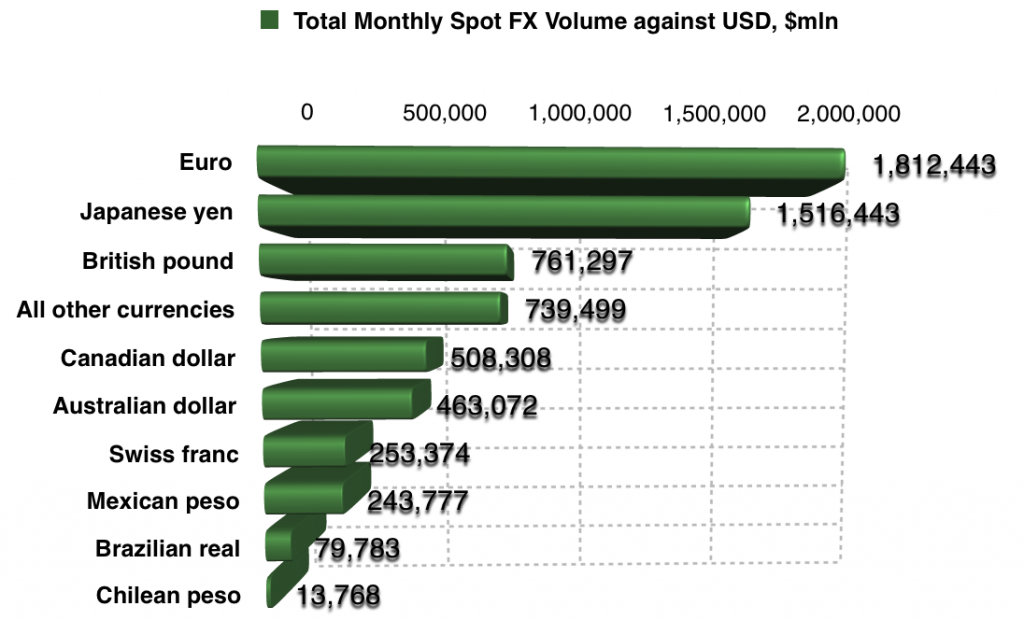
FX Trading Volumes by Currency pair, $ mln

The first chart that we are going to look at lists the total monthly trading volumes against the US dollar. As you can see from the data, there haven't been many surprises here with the main trading activity occurring in the euro, the Japanese yen and the British pound. For the sake of the future of the FX market, we would be very keen to see what the famed Chinese yuan is instead of the Argentinian peso.
Total FX Volumes By Instrument Used

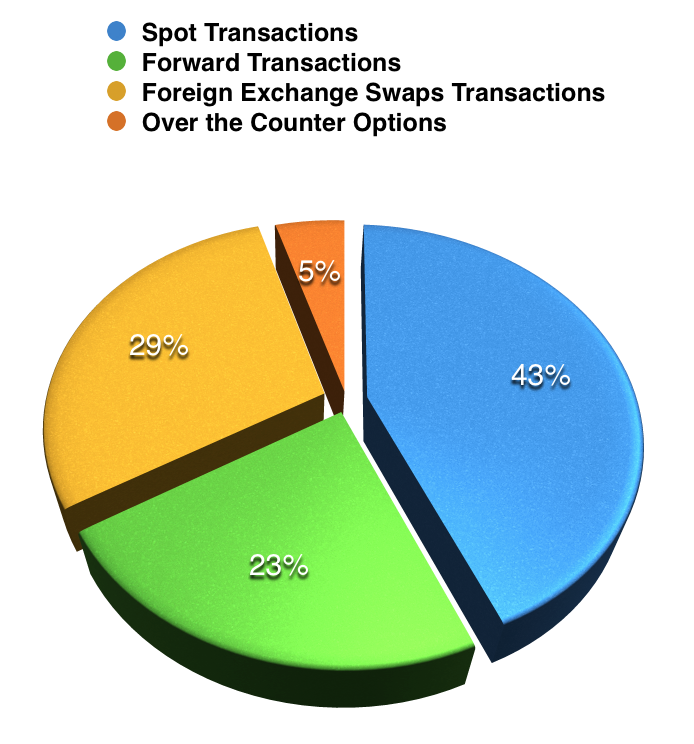
Total FX Volumes By Trading Instrument Used

Spot transactions remain the preferred instrument for trading currencies with 43% of volumes being trasacted on that market. FX Swaps are coming in second, while forwards are holding the thrid position with 23%. Over-the-counter FX options have represeted 5% of the total volume on the FX market in April.
FX Volumes by Execution Method

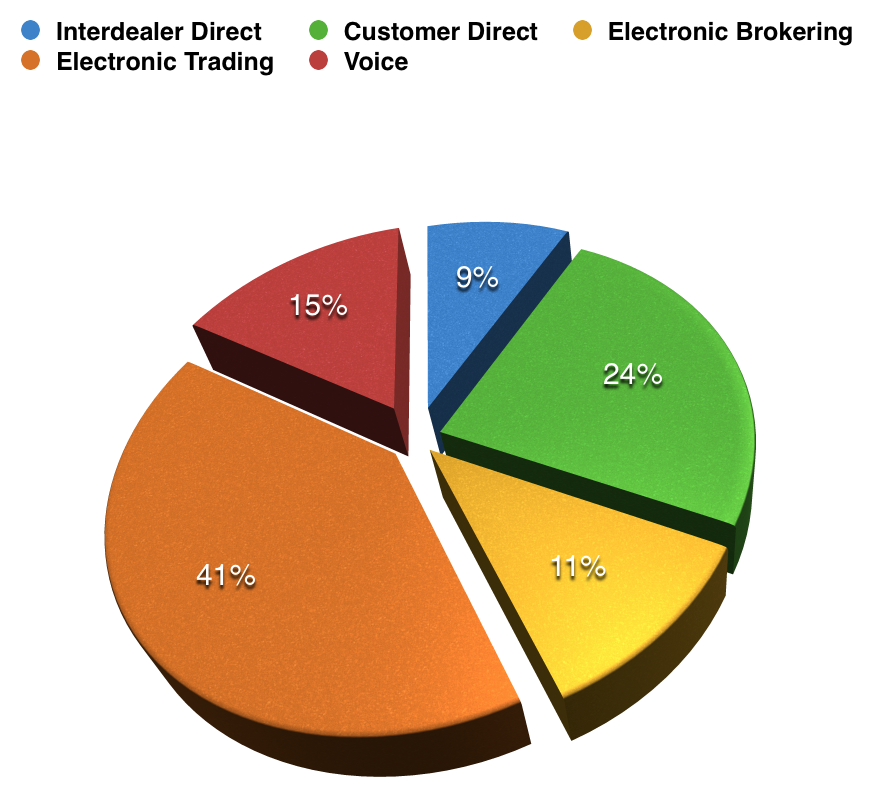
FX Volumes by Execution Method

Moving on to the next chart we are seeing the distribution of FX volumes by execution method. Electronic trading is clearly way ahead here with 41% of transactions going through and electronic brokering adding 11% to that number, totaling more than half of all trades being executed in electronic form. Customer direct trading accounted for 9%. As they say, old habits die hard, so voice orders are surprisingly still rather robust, holding 15% of the market.
Spot Transactions By Counterparty

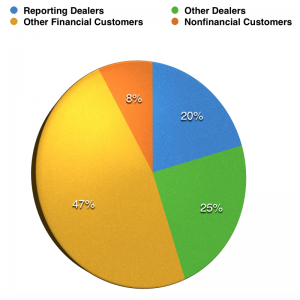
Last but not least, reporting dealers have accounted for 20% of transactions, while other dealers have picked up 25%. Almost half of the volumes traded in the month of April 2014 have been accounted to other financial customers, while the representation of non-financial customers has totaled 8%. The full results from the survey are available by clicking on the following link on the website of the New York FED.

The full list of institutions participating in the survey are as follows: Bank of America, Bank of Montreal, The Bank of New York, Bank of Tokyo-Mitsubishi, Barclays Capital, BNP Paribas, Citigroup, Canadian Imperial Bank of Commerce, Calyon, CSFB, Deutsche Bank AG, Goldman Sachs & Co., HSBC Bank USA, JP Morgan Chase Bank, Mizuho Corporate Bank, Morgan Stanley, Royal Bank of Canada, Royal Bank of Scotland, Skandinaviska Enskilda Bank, Société Générale, Standard Chartered, State Street Corporation, Sumitomo Mitsui Banking Corporation, UBS Bank, Wells Fargo Bank N.A.

About the Author: Victor Golovtchenko
Victor Golovtchenko
  • 3424 Articles
  • 27 Followers
Victor Golovtchenko: Key voice in crypto and FX, providing cutting-edge market analysis.

More from the Author

Retail FX