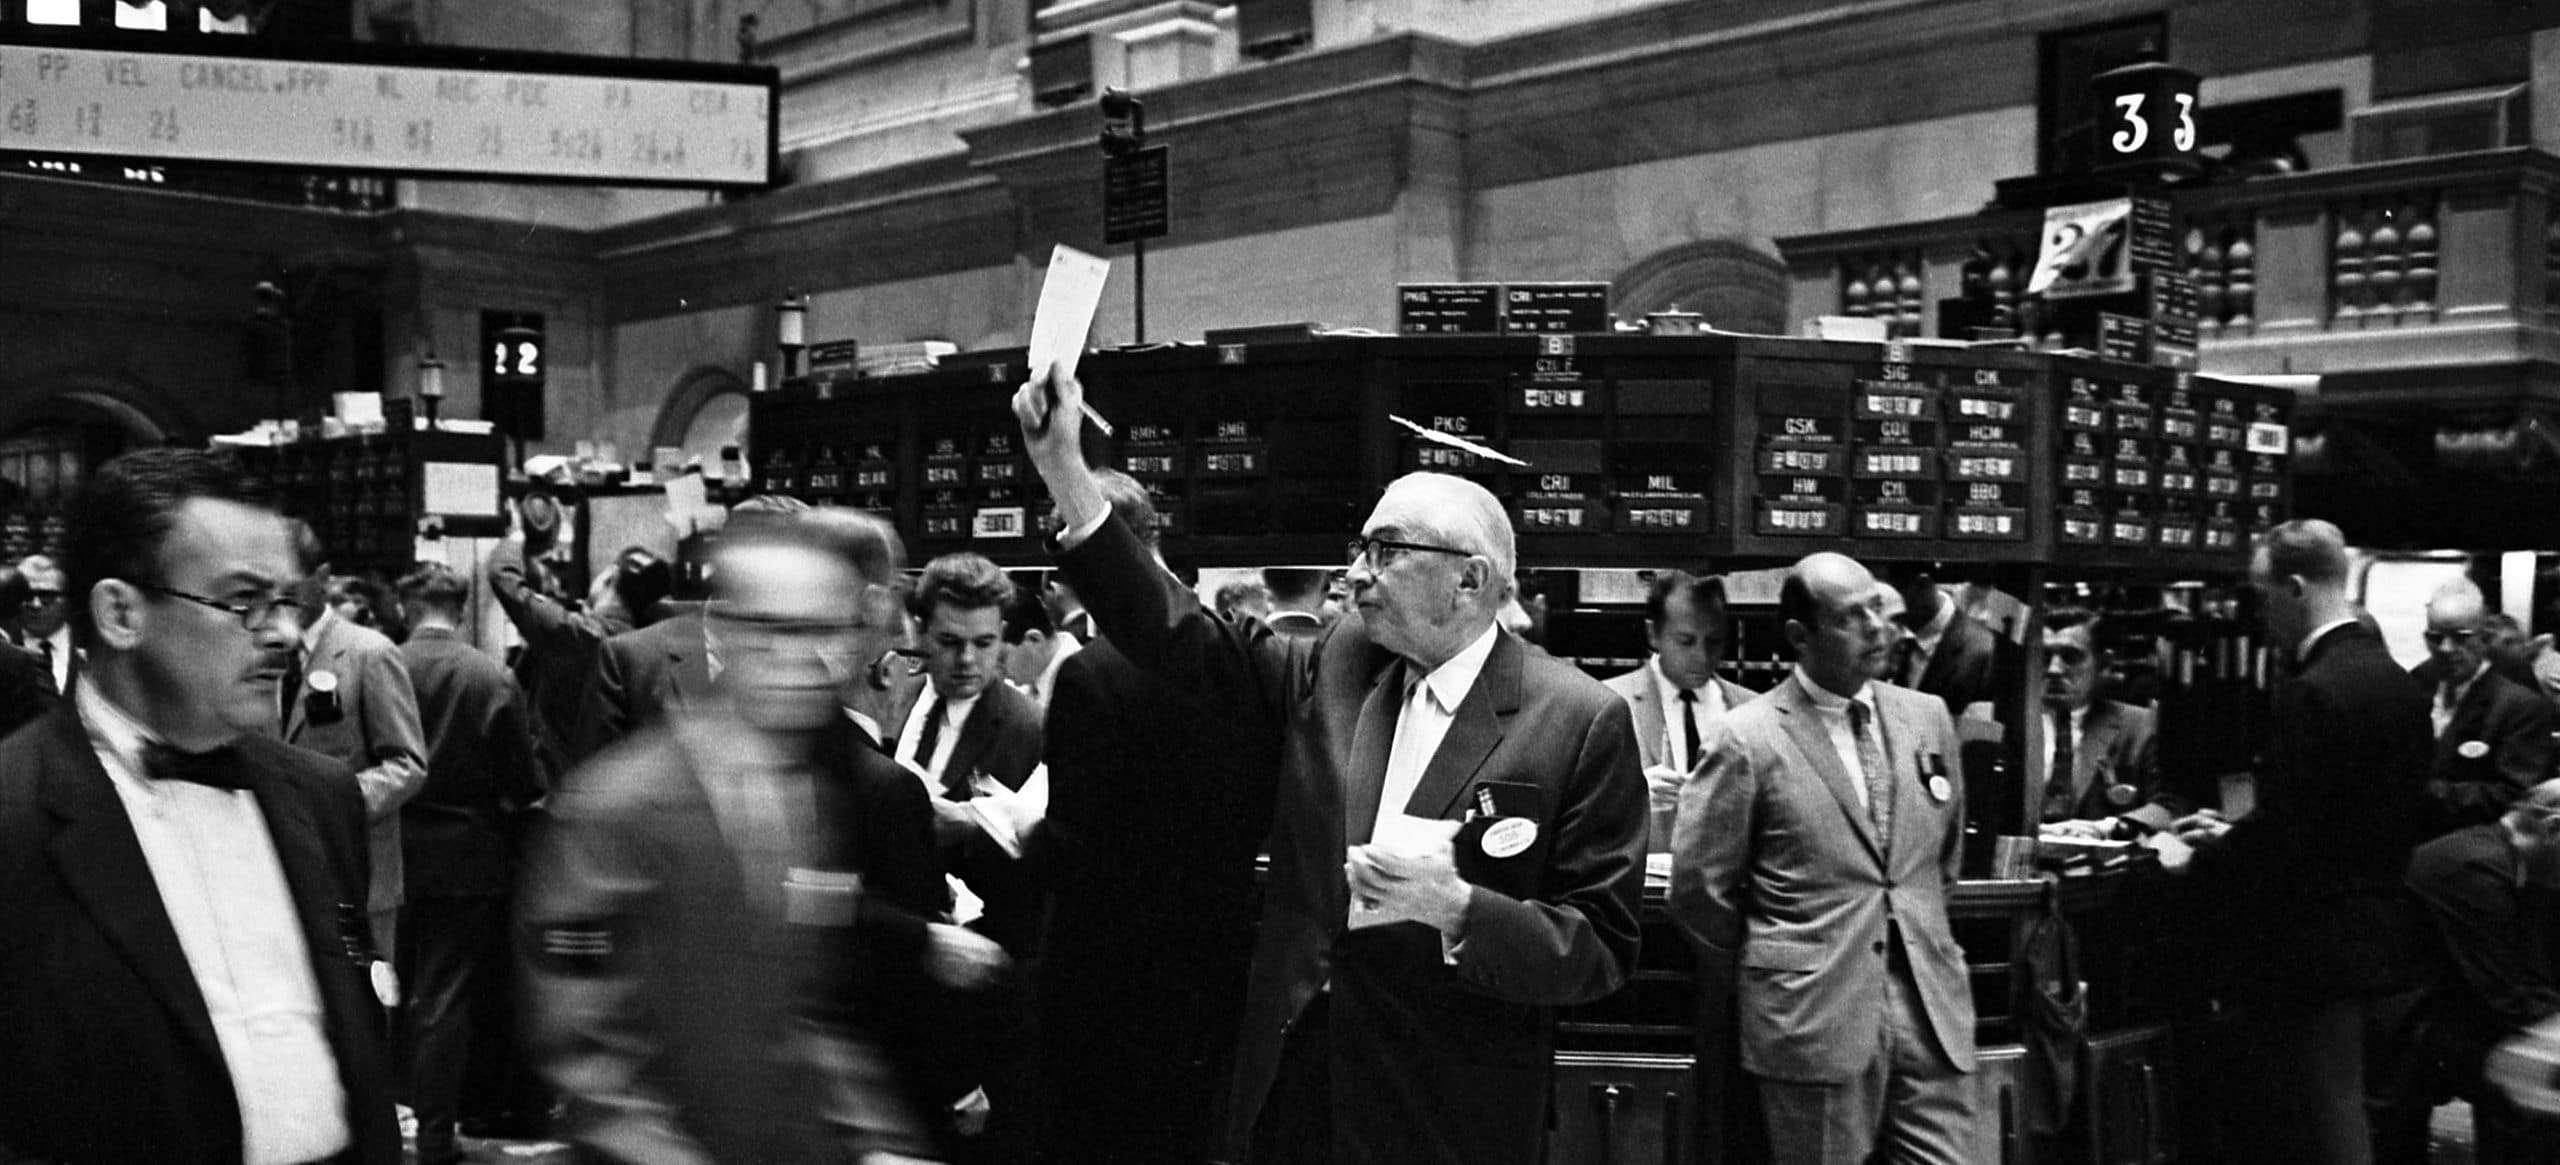
How the September 17th central bank's FOMC announcement could be a gift to the bears
In my August 24th article “Mini Stock Market Crash In Progress” I speculated that a panic bottom could come as soon as August 24/25. As it turned out just after open of trading on August 24th the major US Stock indices did make a panic bottom, with the S&P 500 (SPX) finding support at 1867. This was above the major chart and Fibonacci support of area 1780-1830 that had been mentioned in my previous articles. In addition the weekly RSI which is a great indicator for detecting intermediate bottoms, has recorded for the SPX a reading of 33.26. The level of 30.00 is where the oversold zone begins and implies the SPX could have at least one more move down to new lows.
SPX Resistance Zones
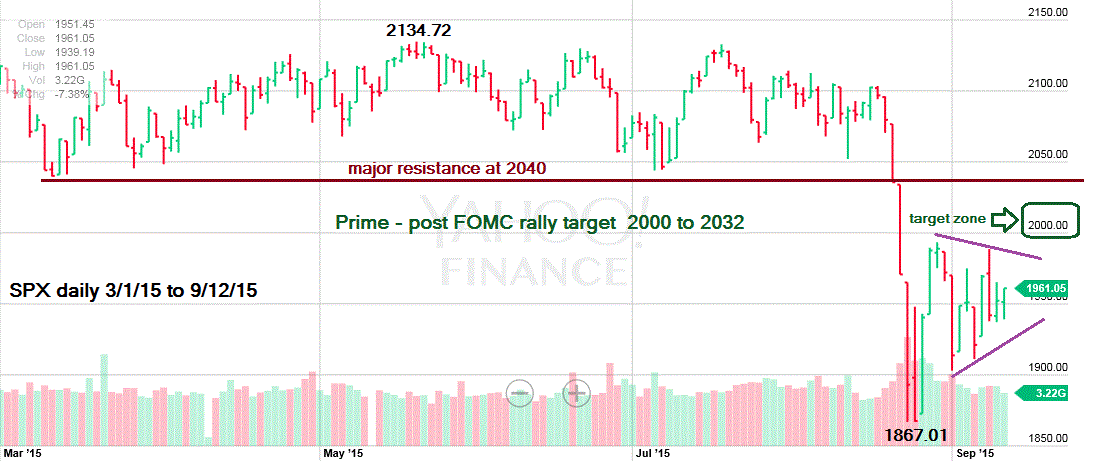
My August 10th article “ Has Mini Stock Market Crash Begun?” pointed at SPX 2040 as very important support and that a break below that support would cause a panic- which is exactly what happened. Now that very important support has become very important resistance, and if the SPX can move above that level it will open the door for a rally back up to at least the high of the year.
SPX 2040 was the last stand for the bulls on the downside and is now the last stand for the bears on the upside. There is however another resistance zone just below 2040 that needs to be examined. A Fibonacci .618 retrace of the SPX 267.71 point decline the high of the year targets SPX 2032.45. A Fibonacci .50 retrace of the same decline targets 2000.86. This is our prime target zone for a near term SPX rally.
Please note the pattern of the SPX after the August 24th bottom appears to be forming an Indecision Triangle. I think what could be happening is more complex, and that an Elliott wave Horizontal Triangle is in progress since the August 28th peak at 1993.
Horizontal Triangles are corrective patterns and in this case it's correcting the upside move up from August 24-28. If this is true, at the completion of the Horizontal Triangle, the SPX will have a sharp thrust up. One reason I think a Horizontal Triangle is forming is that the stock market usually just meanders in a narrow range in the days just prior to FOMC announcements. This is exactly the type of pattern you would expect in the second half of a Horizontal Triangle.
Dow Jones Utility Average
The performance of the Dow Jones Utility Average (DJUA) relative to the SPX has been fascinating to observe. Up until August 20th the DJUA was relatively stronger to the SPX on the upside. After August 20th DJUA has become relatively stronger on the downside vs. the SPX. The three main US stock indices bottomed on August 24th the DJUA bottomed on September 4th , also the DJUA rallies since August 20th have been pathetic.
The DJUA is very sensitive to interest rate changes and this recent weakness is probably a clue that longer term interest rates (30, 10, 5 year US Treasury) will continue rising.
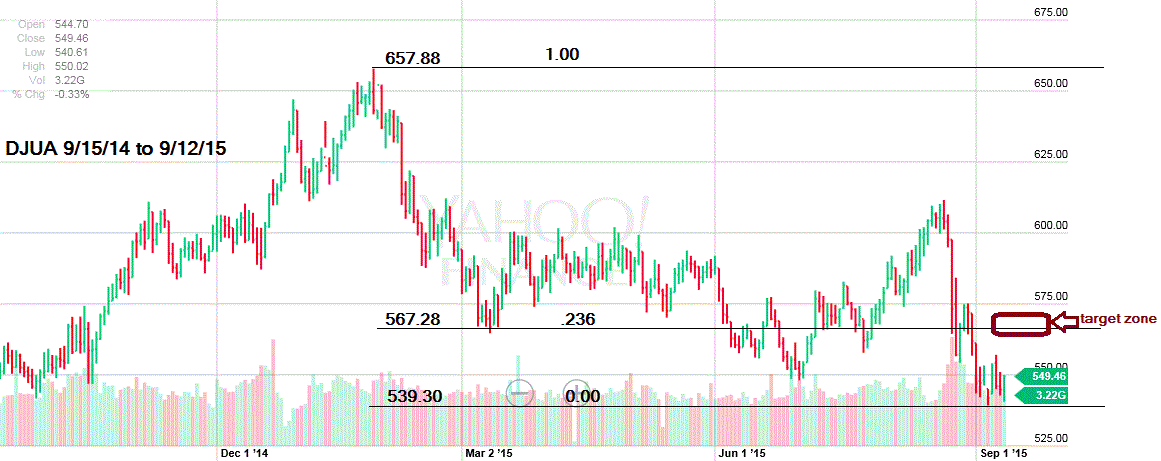
The DJUA can be used as a guide to determine a near term SPX peak. A Fibonacci .236 retrace of the entire DJUA decline from the all time high at 657.88 targets 567.28.
A Fibonacci .382 retrace of the decline from August 20th to September 4th is at 566.92.The closeness of these two Fibonacci targets implies a very strong resistance zone.
If the SPX is trading in the range of 2000-2032 while the DJUA is in the area of 566-567 the probability of a stock market peak would be very high.
Strategy for selling
Because we have clearly defined resistance areas on both the SPX and DJUA we can reduce the risk for shorting stocks, if the market rallies after the FOMC announcement on September 17th. Wait until after the FOMC announcement and go short only if the SPX is trading above the August 28th high of 1993.48, use either 2032 or 2040 as stop loss guide for whatever you are shorting. Because the stock market usually has wild intra day swings immediately after a FOMC announcement it would be best to keep your initial trade small and add to the position the next day.
An SPX move above 1993 could also be a terrific time for anyone holding long stocks or stock funds to sell. If a top in the low 2000 area of the SPX holds, the subsequent move down would probably bottom in the previously defined support zone of 1780-1830. We are now in a seasonably bearish time- if there is another wave down for stocks it would probably at the latest, be completed by the end of October.
Its rare in any market to able to identify a very specific time and price zone for taking action. If after the FOMC announcement the SPX is trading above 1993.48 it would be a gift for the bears. Be prepared for this contingency, if it happens SELL!
FM's Editor-in-Chief Yam Yehoshua on how the newsroom evaluates stories.
Matthew Smith, Group CEO at EC Markets, speaking at FMLS:24
Finance Magnates Annual Awards 2024 | FM Awards 2024 Highlights
🎥Catch the best moments from the Finance Magnates Annual Awards Gala Dinner!
An evening where top names in finance came together to celebrate achievements, enjoy live music, and connect over a memorable dinner. Watch the highlights and feel the energy of our first gala in Cyprus!
Congratulations to all the winners for their dedication to excellence and leadership in the financial industry, including XM, Trading PRO, FP Markets, Deriv, FxPro, LATAM, Headway, ATFX, FBS, AMEGA, EC Markets, Axi
For more information about the 1st Finance Magnates Annual Awards, visit https://bit.ly/3Zb7wNz
#FinanceMagnatesGala #IndustryExcellence #GalaHighlights #FinanceMagnatesAnnualAwards #FinanceMagnatesAwards #CelebratingSuccess #FinanceCommunity
FMLS:24 | Shaping the Next Era of Financial Evolution
Welcome to FMLS:24 – the premier event where influential brands and leaders in trading, payments, fintech, and digital assets come together!
Join over 2,500 industry professionals, engage with 150+ expert speakers, and discover endless opportunities with 70+ top exhibitors. FMLS:24 is where senior executives and decision-makers gather to close deals, forge new partnerships, and strengthen connections with long-term clients.
Whether you’re in finance, technology, or payments, this summit is your gateway to future growth, meaningful collaborations, and industry-leading insights.
👉 Don't miss out – secure your ticket now at https://events.financemagnates.com/ZQEYy0?utm_source=youtube&utm_campaign=fmls24-awareness&utm_medium=video&RefId=MLS%3A24+Video+Promo
#fmls #fmls24 #fmevents #financemagnates #forex #payments #crypto #events #london #fintech #ai #generativeai #technology #onlinetrading #forex #investing #investors #tech
📣 Stay updated with the latest in finance and trading!
Follow FMevents across our social media platforms for news, insights, and event updates. Connect with us today:
🔗 LinkedIn: https://www.linkedin.com/showcase/financemagnates-events/
👍 Facebook: https://www.facebook.com/FinanceMagnatesEvents
📸 Instagram: https://www.instagram.com/fmevents_official
🐦 Twitter: https://twitter.com/F_M_events
🎥 TikTok: https://www.tiktok.com/@fmevents_official
▶️ YouTube: https://www.youtube.com/@FinanceMagnates_official
Don't miss out on our latest videos, interviews, and event coverage. Subscribe to our YouTube channel for more!