Of Belgian Hens and Big Data

Monday, 04/04/2016 | 08:27 GMT by Nicc Lewis
  • Recently I decided that I wanted to make a point about how numbers can both represent and misrepresent the facts.
Of Belgian Hens and Big Data
Bloomberg

Big Data is the rage. Surely making decisions based on data and trends can Yield optimized and better performance? As CMO of Leverate, with over a decade of using data as part of my profession, I can say the answer is both yes and no.

Recently I decided that I wanted to make a point about how numbers can both represent and misrepresent the facts. To illustrate my findings, I will show you some examples that may make both brokers and traders sit up and take note.

I started by looking into trend lines and matching correlations of the usage of our platforms and possible external forces.
Courtesy by Leverate

Chart courtesy of Leverate

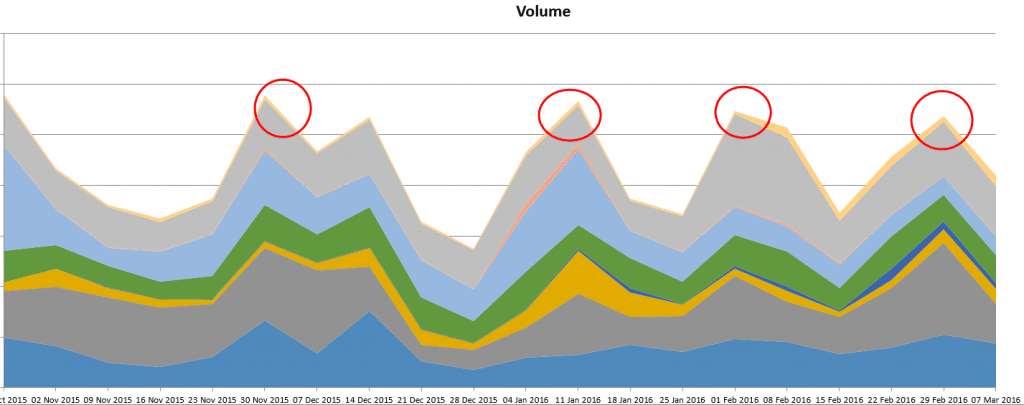
The chart above shows weekly volume of trades. Highlighted are the peaks and they correlate quite comfortably with the beginning of each month, and this is logical as this is salary time.

Traders are obviously more inclined to trade when their funds are at the fullest. So far, so good.

Next, I looked to see if there was a correlation between volume traded and the price of euro/USD:

Courtesy of Leverate

Chart courtesy of Leverate

There seems to be some correlation here. As the price goes up so does trading volume. Perhaps the feel-good factor of buying rather than selling has an influence on how much traders trade?

The next step was to see if there was a particular platform that is even more closely correlated to this pattern.

It seems as though the download platform (rather than mobile or web) is the main source of the correlation.
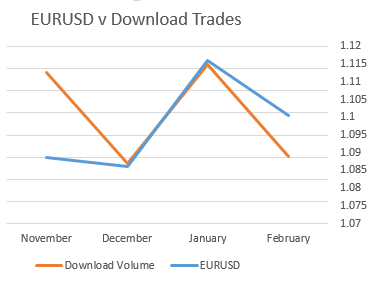
A logical argument could be made that the download platform is more widely used and it would indicate the initial findings – as price rises, so does trading volume.

As a broker I may be tempted to use this information and build a marketing program to take advantage of the two pieces of information in my possession. Contact traders at the beginning of each month to increase retention at the optimal time for them. Secondly, I can follow the trends of the currency pair and message traders when the trend is up, alerting traders to their favorite time to trade.

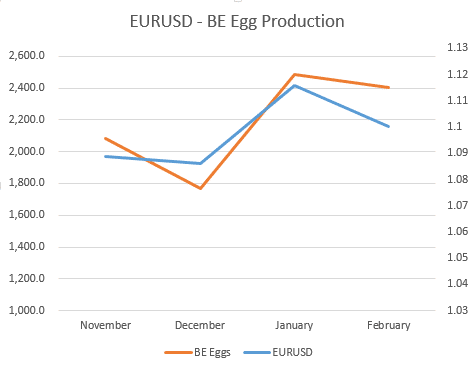
Once I reached a conclusion about these correlations, I downloaded an EU report into monthly egg production and the placement of egg laying hens per country. It turns out that farmers in Belgium are also affected positively by the price of euro versus USD.
graph 4

This could make sense as well. Effectively the euro has more value and therefore it is a good time to invest in egg producing hens. Or, maybe the same feel-good factor that traders have with a positive market affects the optimism of Belgian farmers?

But wait, if the graphs between euro-USD and trading volume and the euro-USD and Belgian egg production correlate, then obviously there is a correlation between volume traded and egg production in Belgium...
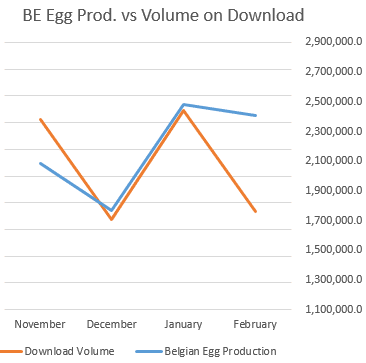
Courtesy of Leverate

Courtesy of Leverate

It also turns out that mobile trading is positively affected by the number of egg producing hens in Germany!
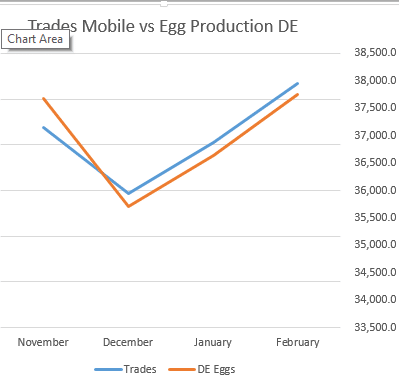
Courtesy of Leverate

Courtesy of Leverate

So my new marketing plan says to contact traders at the beginning of each month. Also contact traders when egg production in Belgium goes up to trade on download and watch German hens for mobile trading. Easy!

About the Author: Nicc Lewis
Nicc Lewis
  • 14 Articles
  • 7 Followers
Nicc Lewis is the Chief Marketing Officer at Leverate. He is responsible for the company’s marketing endeavors including product launches, strategy, campaigns, online and offline marketing and branding. Nicc brings more than 10 years of executive level marketing experience in the digital marketing industry. Nicc Lewis is CMO at Leverate. He is responsible for the company’s marketing endeavors including product launches, strategy, campaigns, online and offline marketing and branding.

More from the Author

Retail FX