Risk Measurement Pitfalls When Trading the Markets

Monday, 27/04/2015 | 06:19 GMT by Vlad Gubernat
  • The hidden perils of misrepresenting and miscalculating risk factors are sure to derail a trader's chances to beat the market
Risk Measurement Pitfalls When Trading the Markets

I think it's safe to say that more money has been lost through wrong measurement of risk - which gives one a false sense of security - than by failure to measure risk at all. To provide an analogy, it would be safer to drive a car without a speedometer than a car with a speedometer which understates the true speed by 25%.

If there was no actual gauge of the speed, you would be conscious of that absence of information and as a result would take extra caution. If instead you are relying on a speedometer that shows 60 kmph when in fact the true speed is 75 kmph or higher, then you will be more prone not only to speeding tickets, but accidents as well.

Similarly in trading, relying on risk measurements that significantly understate true risk may be far more dangerous than not using any risk measurement at all. The most recent example to illustrate this is January 15th's SNB debacle.

The constant assurance of the Swiss officials that the EUR/CHF peg was there to stay, coupled with low margins for CHF pairs offered by brokers who should have known better led to hundreds of millions in aggregate losses.

Would there have been so many traders affected had they not listened to officials talking their book? Would there have been so many brokers affected - I'm looking at you FXCM - had they raised margins accordingly for a currency, which was no longer free floating? I think everyone would agree the answer to both questions is a resounding NO.

Another example of faulty risk measurement that comes to mind, seven years since Bear Stearns imploded, is the trillion-dollar-plus losses suffered by traders and investors in 2007-2008 in debt securitizations linked to subprime mortgages. Investors bought these securities because they had AAA ratings from top rating agencies. But the risk evaluation behind the top grades was based on assumptions that had nothing to do with the underlying data - holdings that consisted of low quality subprime mortgages.

What would have happened if investors were offered unrated debt securities with a collateral that consisted of subprime mortgages with no income, job, down payment or asset verification? Very few would have touched them. Yet investors bought huge quantities of these securities because of the implicit assurance provided by the AAA rating.

Before finishing, I would also like to touch on the false security given by track records with a seemingly ever rising balance slope. Just looking at the graph and not considering the strategy used to obtain those numbers is not only meaningless, but potentially dangerous too.
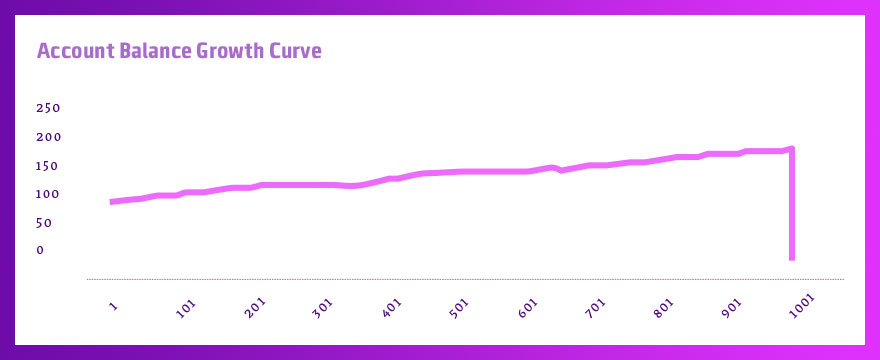
Retail-FX_Account-Balance-Growth-Curve_6.4-1

As you can see in the picture, everything was wonderful up to the 1000 time units (which could be days, weeks or months) mark. Then, a time unit later, the account blows up. This is typical for some strategies used in low Volatility markets with moderate moves. They make money while the market stays in a certain price range, but are prone to severe and accelerated losses when the market witnesses a sharp and sustained movement in either direction - think EUR/USD or Oil over the past year. The conclusion is that risk assessments based on past track records are prone to be highly misleading if the period covered coincided with an overly favourable environment for the strategy.

About the Author: Vlad Gubernat
Vlad Gubernat
  • 9 Articles
  • 6 Followers
Vlad Gubernat is a full-time trader based in Romania who shares his thoughts on his blog JLTrader. Independent trader and blogger on everything trading related.

More from the Author

Retail FX