Stock Markets at the Tipping Point

Tuesday, 02/08/2016 | 09:02 GMT by Guest Contributors
  • Could US stocks be ready for an intermediate decline? Evidence indicates a drop may be imminent.
Stock Markets at the Tipping Point
pixabay

This article was written by Mark Rivest, independent investment advisor, trader and writer.

The S&P 500 (SPX) has reached an important resistance area at the same time that an important technical indicator is hinting at a decline. The SPX may have hit an intermediate peak on July 29, 2016. If not a top could come in just a few trading days. A close look at the SPX and an important stock strongly suggest now is the time for defensive action.

S&P 500 resistance

Fibonacci retracements and extensions are used to determine market support and resistance.
SPX daily 7-30-16-2

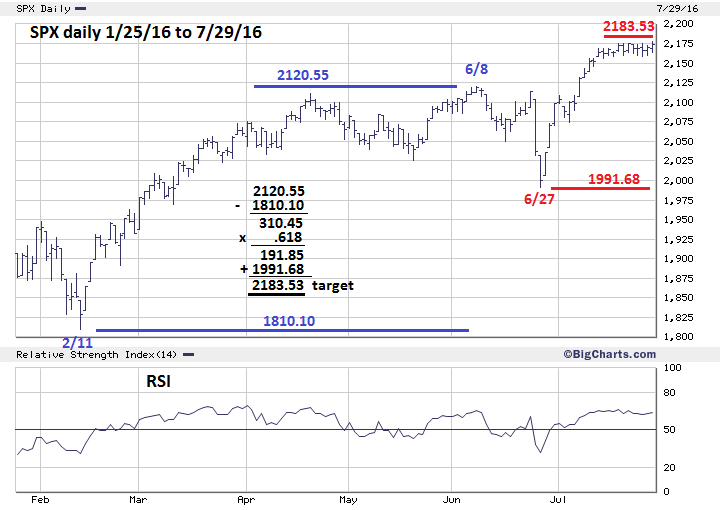
Measuring the length of the first rally from February 11th to June 8th and multiplying this by the Fibonacci golden ratio of .618 yields 191.85 points. Adding this to the low of the so far most significant decline of 2016 (Brexit bottom – 1991.68) targets SPX 2183.53 as a possible resistance area.

Is it necessary for the SPX to have a direct hit at 2183? No, just like in the game of horse shoes – close counts. Any Fibonacci support/resistance point always allow for some leeway. In this situation plus or minus eight to ten points from 2183.53 would be acceptable leeway.

The peak made on July 29, 2016 at 2177.08 is within the leeway zone so an intermediate peak may already be in place.

A lunar time cycle may also be signaling that the stock market is at or near a peak. Occasionally stock markets will top on or near a new moon, plus or minus two trading days. There is a new moon on August 2, 2016 plus or minus two trading days gives a range of July 29 to August 4.

S&P 500 three-year history
SPX weekly 7-30-16-2

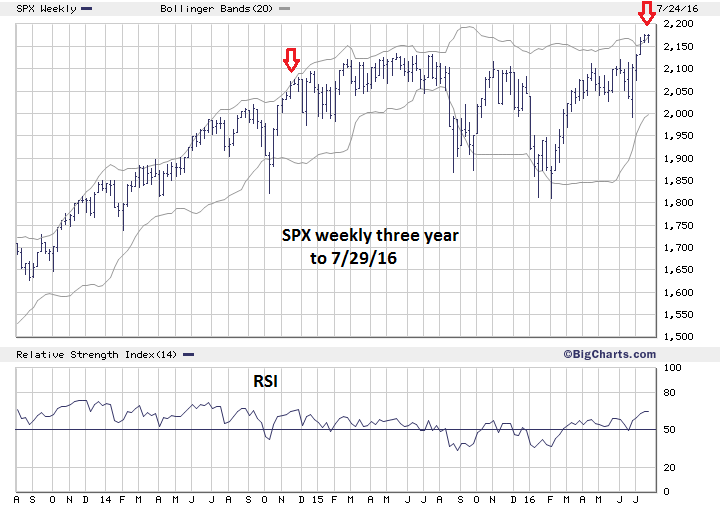
Recently the SPX has done something that has not happened since November 2014 - trade above the upper weekly Bollinger band.

Trading above the upper Bollinger band doesn’t guarantee there will be a top. Sometimes regardless of the time scale there could be several consecutive trading bars above the upper Bollinger band.

However, this phenomenon is usually related to a dynamic rally. This is not what has happened in July 2016 as there are currently three weekly bars above the upper band on a sideways move. Stalling above the upper Bollinger band is definitely bearish and implies at least a decline of two to three weeks could begin very soon.

Alphabet Inc.
GOOGL daily 7-30-16-2

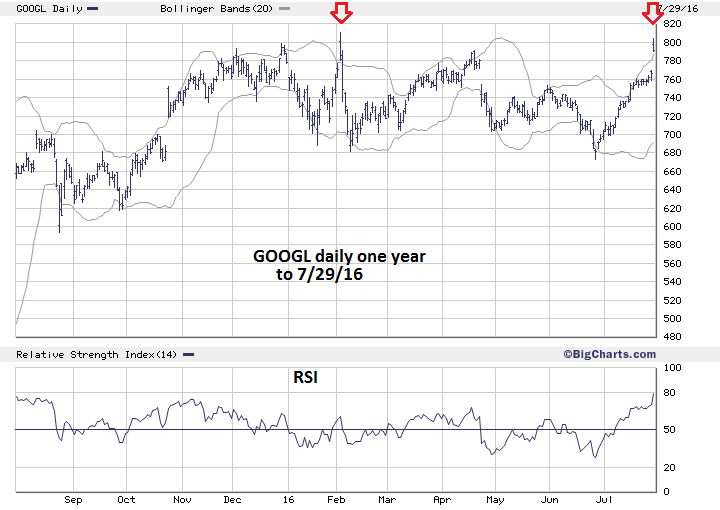
Note that on July 29th not only is GOOGL trading above the upper Bollinger band but it is completely outside the upper band. On the daily scale this phenomenon only occurs once or twice a year and is a signature of a buying panic. Early February was the last time GOOGL traded completely outside upper daily Bollinger band.

After GOOGL traded completely outside the upper band it declined one hundred points in only four trading days! It’s possible that in the next one to two weeks GOOGL could repeat this performance.

GOOGL is a major stock within the NASDAQ composite which has been leading the rally since July 20th. A near term decline in GOOGL will probably contribute to a decline in NASDAQ which would probably trigger declines in the other US stock indices.

Conclusion

If a stock market peak is forming why should we consider it an intermediate top and not a major top? Because the Relative Strength Indicator (RSI) is an excellent tool to discover major peaks.

Regardless of the time scale the RSI almost always has at least one bearish divergence at a major/significant top. Note that as of July 29th both the weekly SPX and daily GOOGL RSI have no bearish divergences. Only the daily SPX RSI has a marginal bearish divergence which could be erased if the SPX moves higher in the next few trading days. Even if the SPX high on July 29th was to hold the marginal divergence it is still not confirmed by the weekly RSI.

The bulk of evidence suggests that if US stocks decline, it would probably be only a multi-week correction within an ongoing bull market.

Near term stock traders and investors should get defensive. Hedge long positions and/or take profits. If you’re long GOOGL definitely take profits.

About the Author: Guest Contributors
Guest Contributors
  • 410 Articles
  • 9 Followers
This could be your profile next week. Simply apply!

More from the Author

Retail FX