Stocks, Crude and Yen Set Up for Volatile Moves This Week

Wednesday, 13/04/2016 | 07:58 GMT by James Hyerczyk
  • Yen traders should be ready for more volatility this week, especially if the BoJ steps in with an aggressive intervention.
Stocks, Crude and Yen Set Up for Volatile Moves This Week
Bloomberg

The focus for investors this week will be on the U.S. stock indices, crude oil and the Japanese yen. All three markets posted significant moves on their weekly charts that have caught the interest of most fundamental and technical traders.

U.S. stock indices finished sharply lower on Friday, completing a potentially bearish closing price reversal top on the weekly charts. The major indices declined more than 1 percent for the week, the worst since February 5 for the June E-mini S&P 500 and June E-mini NASDAQ-100 Indices and the worst since February 12 for the June E-mini Dow Jones Industrial Average futures contract.
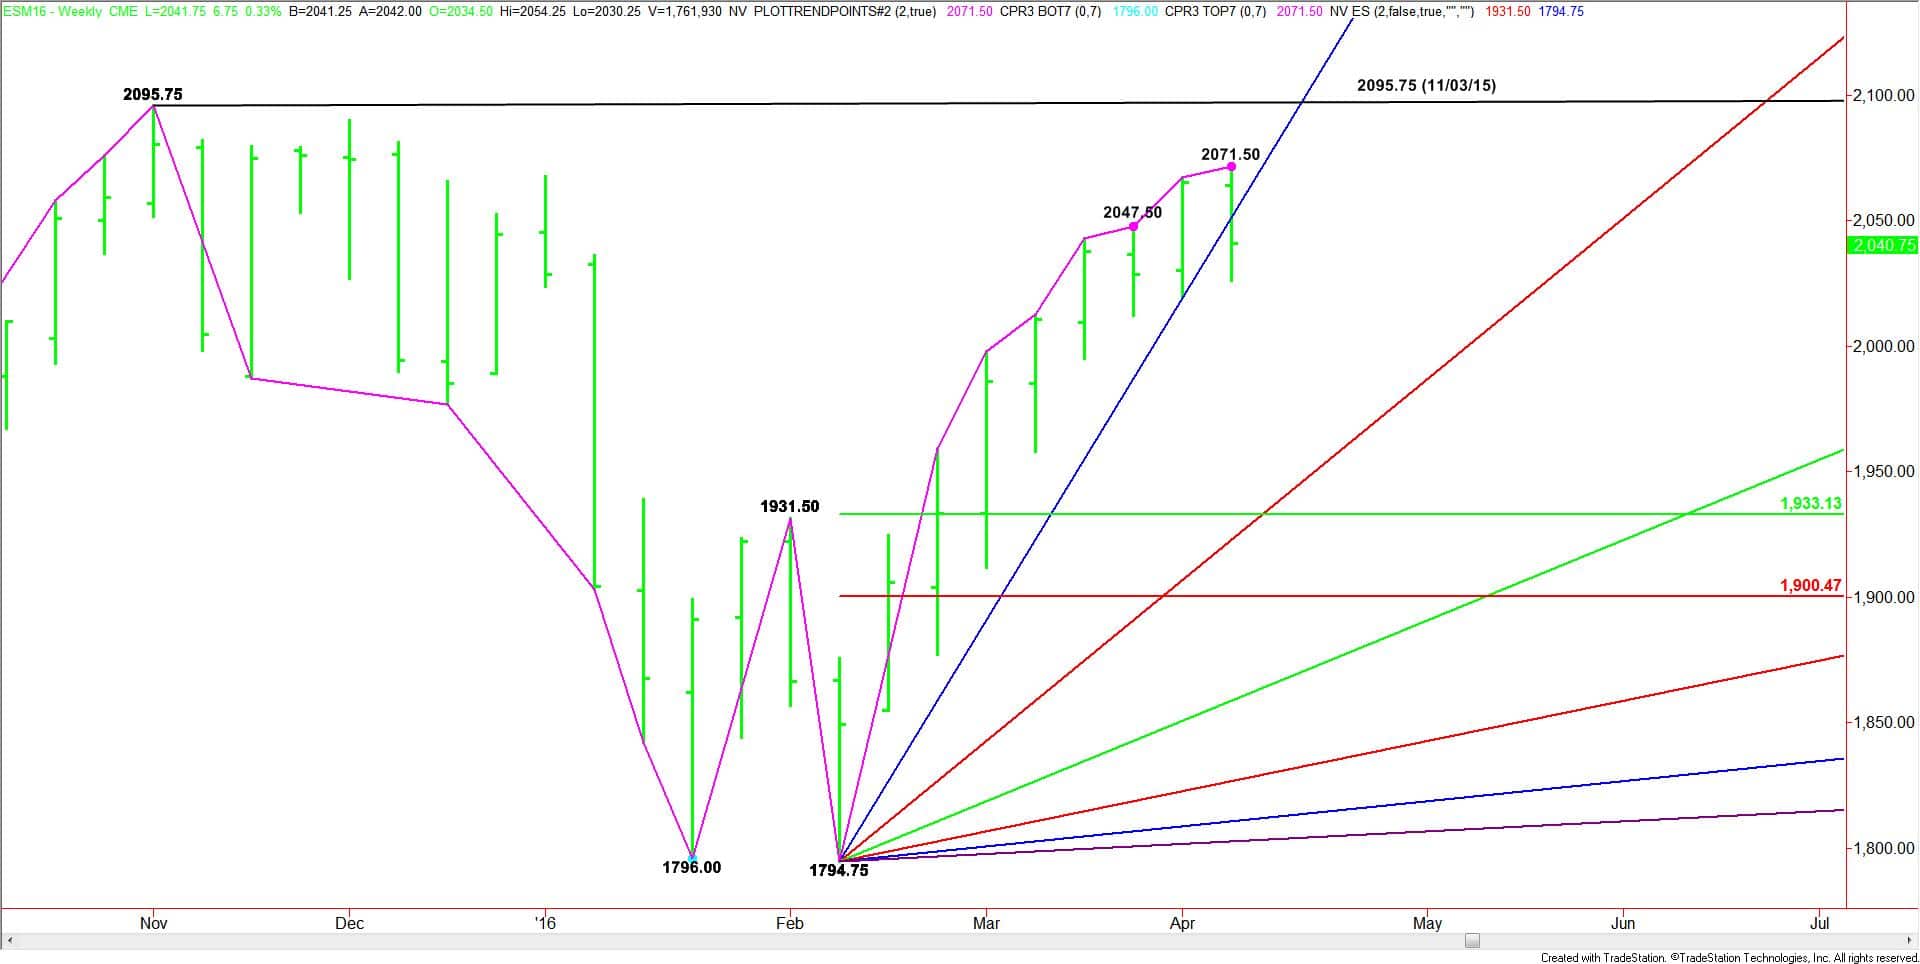
Weekly June E-mini S&P 500 Index

The June E-mini S&P 500 Weekly chart indicates that the key level to watch this week is 2026.00. A trade through this level will confirm the closing price reversal top. This could trigger an acceleration to the downside with 1933.00 to 1900.50 the primary downside target over the next 2 to 3 weeks.

June E-mini NASDAQ-100 Index futures also posted a potentially bearish chart pattern on the weekly chart. Taking out 4450.75 with conviction will confirm the top and set up the index for a steep sell-off. A sustained move under this level will indicate the presence of sellers with 4205.75 to 4126.00 the primary downside target over the next 2 to 3 weeks.

The key number to watch on the June E-mini Dow Jones Industrial Average chart is 17396. Taking out this level will confirm its closing price reversal top. A confirmation of a reversal top doesn’t mean the trend is changing to down, but it could lead to the start of a 2 to 3 week counter-trend move. The primary downside target is 16526 to 16236.

The closing price reversal top chart pattern is often indicative of overbought conditions. Although it can eventually lead to a change in trend to down, in this case, it indicates profit-taking. Last week’s price action may be a sign that the buying has dried up, giving long investors an excuse to book profits. If all works as expected, the break should take the indices back to a value zone which has been defined as 50% to 61.8% of the February 11 to April 4 rally.
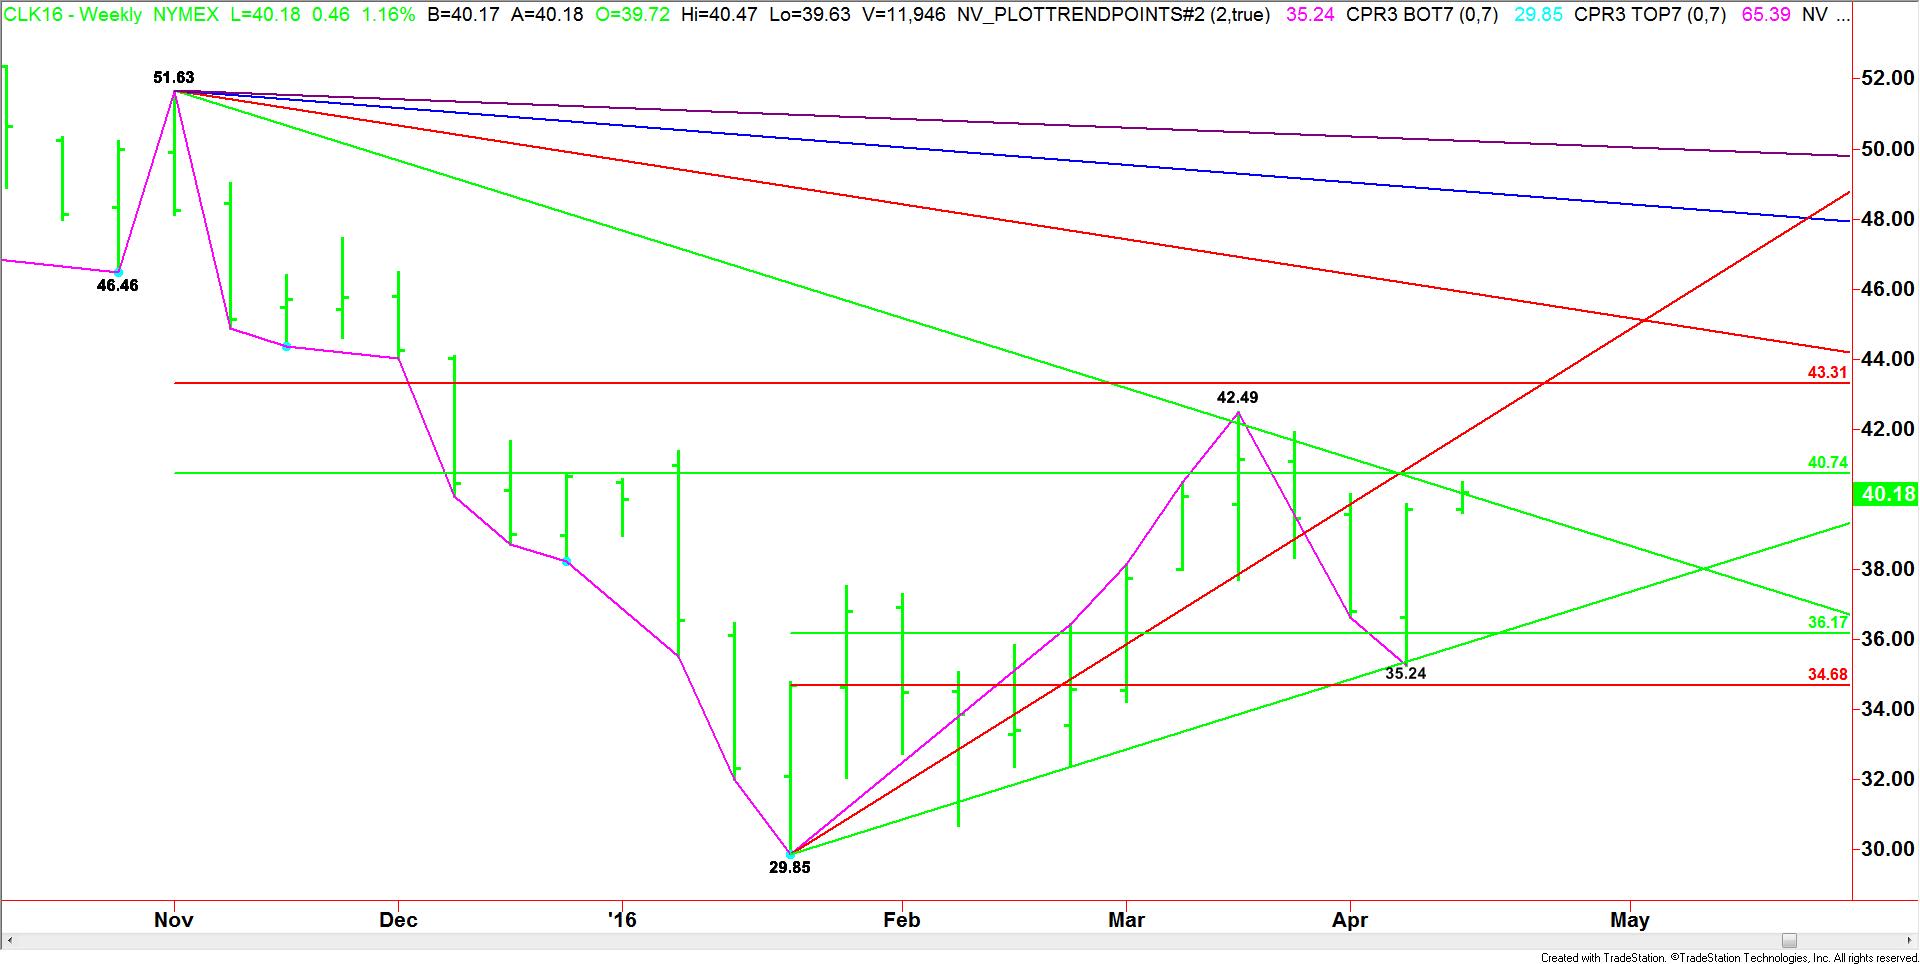
Weekly May Crude Oil

May Crude Oil futures posted a huge rally last week after successfully testing a major retracement zone at $36.17 to $34.68.

The main trend is down according to the weekly swing chart, but the strong rally has put the market in a position to challenge the last swing top at $42.49. A trade through this top will change the main trend to up.

The main range is $51.63 to $29.85. Its retracement zone is $40.74 to $43.31. This zone is the primary upside target.

Traders are going to have to watch the price action and read the order flow inside $40.74 to $43.31 and at the $42.49 main top to determine whether buyers have taken control, or if sellers are still present.

Finally, the USD/JPY plunged last week, hitting a low of 107.655, a level not seen since October 2014. The yen’s huge rally is taking place despite efforts by the Bank of Japan to lower the value of its currency to stimulate the country’s export-driven economy. If you recall, the central bank implemented an aggressive negative interest rate strategy in January, but recent economic news indicates it has had very little impact on the currency.
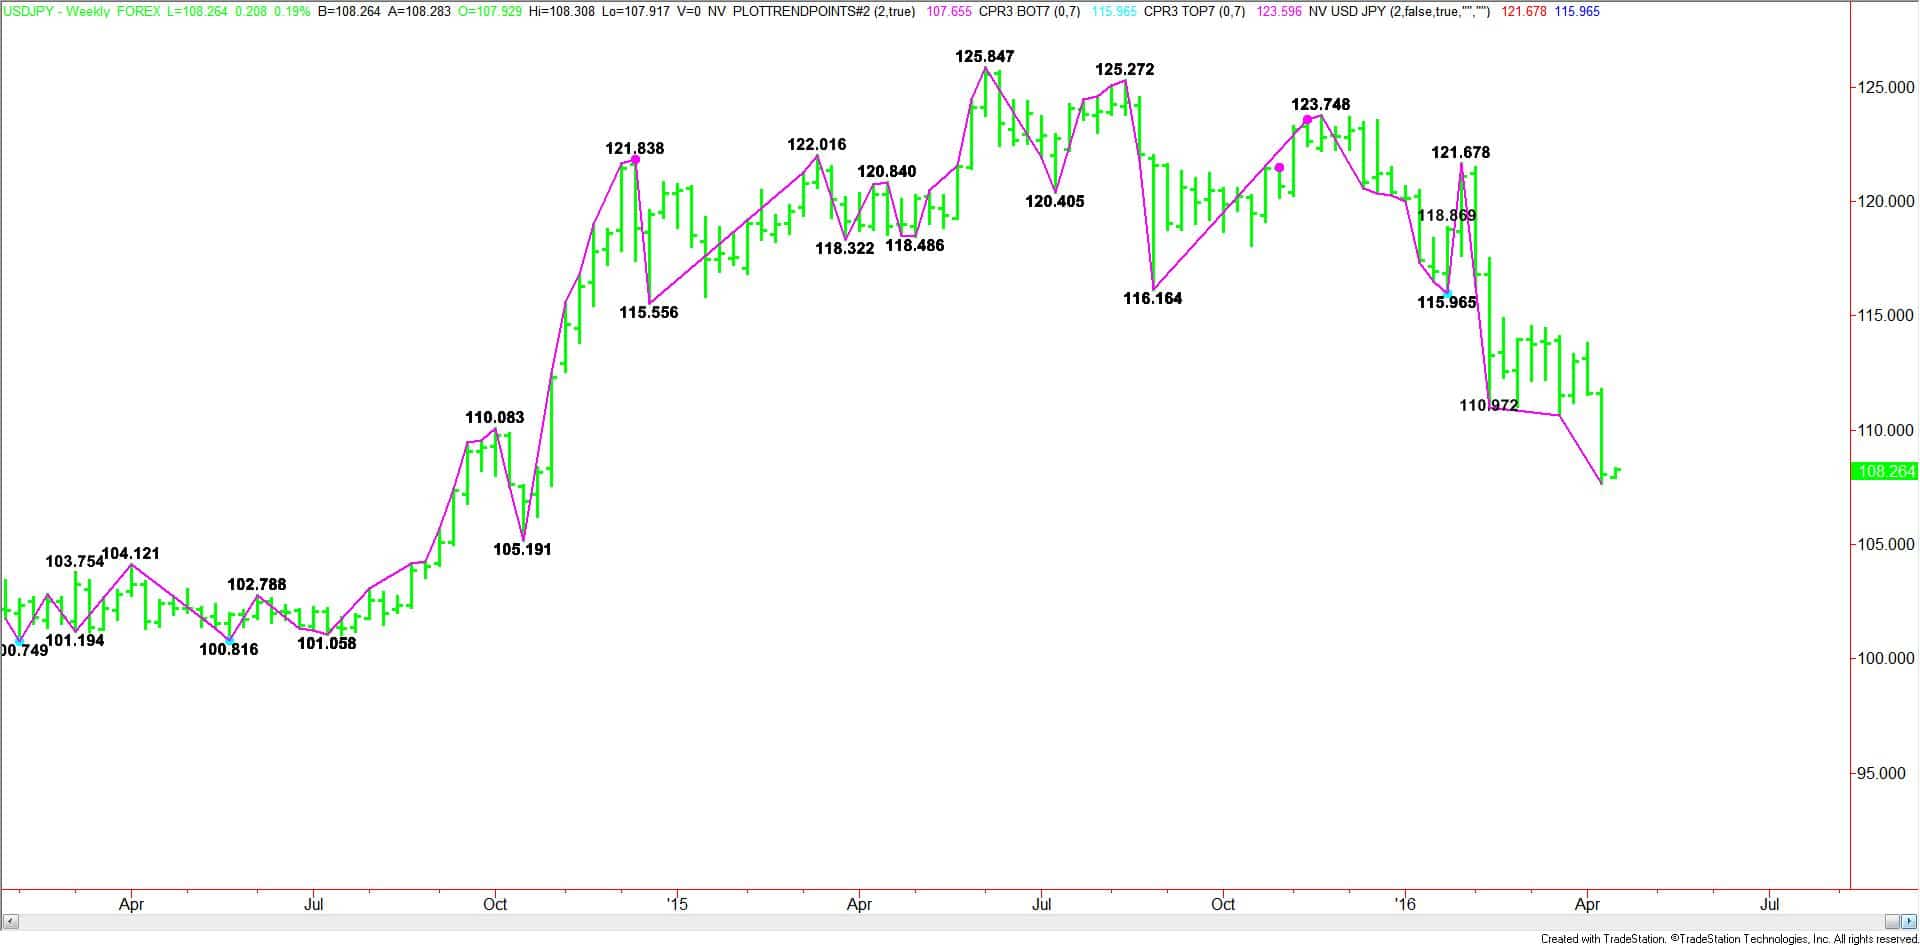
Weekly USDJPY (1)

Several Japanese officials spoke up and expressed their opposition to the rapid rise in the yen. Japanese Finance Minister Taro Aso said on Friday that the government would take steps as needed, while declining to comment on any intervention in the market. Yoshihide Suga, the cabinet secretary, said at a news conference: “We’re watching the foreign market with a sense of tension, and we’ll take measures as appropriate."

Japanese yen traders should brace themselves for more Volatility this week especially if the Bank of Japan steps in with an aggressive intervention.

About the Author: James Hyerczyk
James Hyerczyk
  • 40 Articles
  • 8 Followers
James A. Hyerczyk is a financial analyst for FX Empire, a leading financial portal. James has worked as a fundamental and technical financial market analyst since 1982. His technical work features the pattern, price and time analysis techniques of W.D. Gann. James A. Hyerczyk is a senior analyst at FX Empire. He has worked as a fundamental and technical financial market analyst since 1982. His technical work features the pattern, price and time analysis techniques of W.D. Gann.

More from the Author

Retail FX