Trade of the Week: EURUSD at Key Crossroads

Monday, 07/12/2015 | 12:21 GMT by James Hyerczyk
  • According to the current set-up, a trade through last week’s high at 1.0980 will confirm the closing price reversal bottom.
Trade of the Week: EURUSD at Key Crossroads

Last week, the European Central Bank triggered a massive short-covering rally by the EUR/USD when it revealed what was perceived by investors to be a soft stimulus package. The build-up leading into the ECB’s decision on December 3 had led many short-sellers to believe that the central bank would present a stimulus package that was powerful enough to drive consumer inflation higher over the near-term.

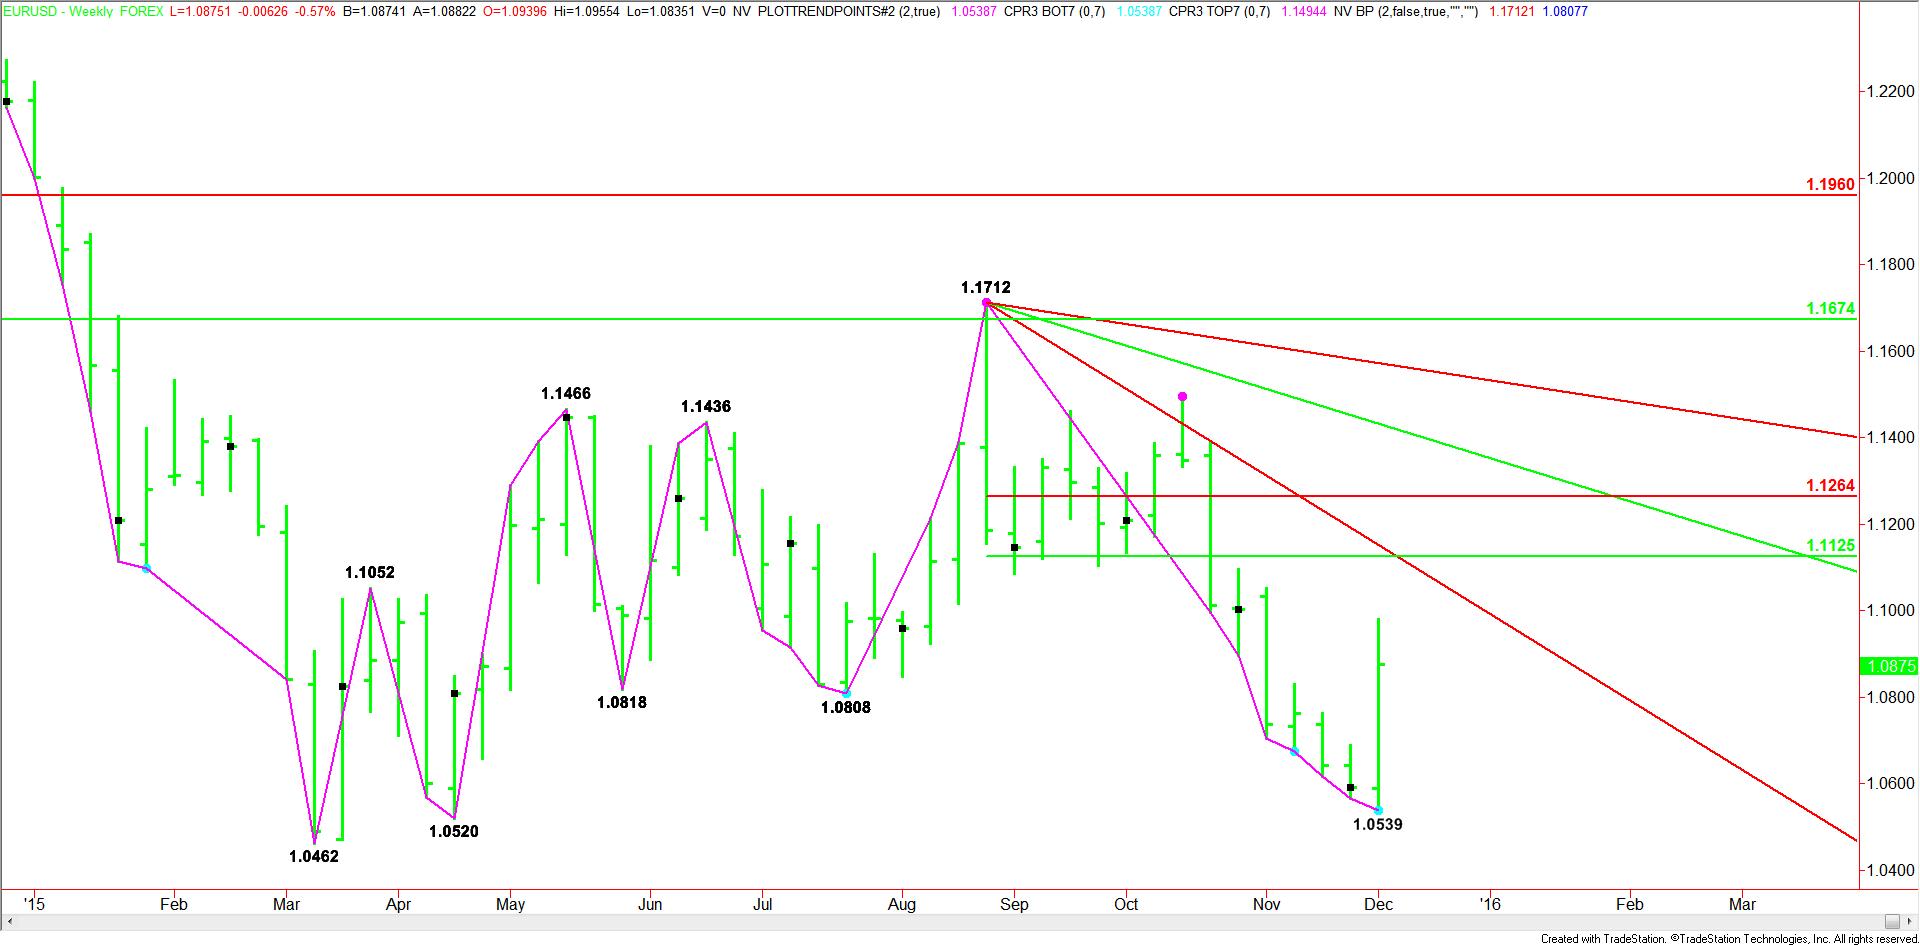
The size of the short-covering rally not only turned the main trend to up on the daily chart by taking out three-week’s worth of highs, but it also produced a potentially bullish closing price reversal bottom on the EUR/USD weekly chart.
Weekly EURUSD

The formation of a closing price reversal bottom on the weekly chart doesn’t mean the trend is getting ready to turn to up, but it could lead to a 2 to 3 week rally equal to 50% to 61.8% of the last meaningful sell-off. Since it is a pure momentum play that is driven by short-covering, the key to this chart pattern will be the follow-through move.

According to the current set-up, a trade through last week’s high at 1.0980 will confirm the closing price reversal bottom. In keeping with the momentum theme, we’d like to see this price taken out with conviction in order to complete the move. In other words, when taking out this high, buy stop volume has to be accompanied by aggressive counter-trend buying or the breakout rally may fail.

The new short-term range is 1.1712 to 1.0539. Its retracement zone is 1.1125 to 1.1264. If there is a sustained rally through 1.0980 then our first objective will be the 50% level at 1.1125. If the buying continues then our next objective becomes the Fibonacci level at 1.0539.

In addition to the 50% level at 1.1125, traders can use the downtrending angle at 1.1112 as a potential target.

Watch the price action and read the order flow at 1.0980 this week, trader reaction to this level will tell us whether the bulls or the bears are in control. If this level is taken out with conviction then look for the short-covering rally to extend possibly into a potential resistance cluster at 1.1112 to 1.1125.

About the Author: James Hyerczyk
James Hyerczyk
  • 40 Articles
  • 8 Followers
James A. Hyerczyk is a financial analyst for FX Empire, a leading financial portal. James has worked as a fundamental and technical financial market analyst since 1982. His technical work features the pattern, price and time analysis techniques of W.D. Gann. James A. Hyerczyk is a senior analyst at FX Empire. He has worked as a fundamental and technical financial market analyst since 1982. His technical work features the pattern, price and time analysis techniques of W.D. Gann.

More from the Author

Retail FX