US Stock Indices Poised to Fall Further if Fed’s Brainard Turns Hawkish

Tuesday, 13/09/2016 | 17:55 GMT by James Hyerczyk
  • Misinformation from the Fed is pushing investors into wait-and-see mode.
US Stock Indices Poised to Fall Further if Fed’s Brainard Turns Hawkish
Bloomberg

This guest article was written by James Hyerczyk, financial analyst at FX Empire.

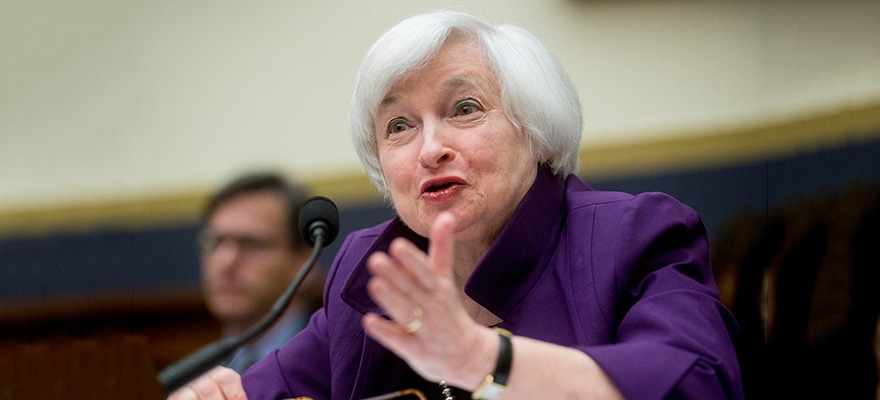
U.S. stocks ended Monday’s session sharply higher, after Fed Governor Lael Brainard said it would be wise for the central bank to keep monetary policy loose. This surprised traders because many thought she would offer hawkish commentary. As a result of her comments, all three major indices rallied late to close higher for the day.

The new world of online trading, fintech and marketing – register now for the Finance Magnates Tel Aviv Conference, June 29th 2016.

To some, Brainard’s comments may have taken a September interest rate hike off the table, but the price action in the major indices still suggests that investors are not going to give in that easily. Last Friday, the Dow, for example, lost nearly 400 points on hawkish comments from Boston Fed Governor Eric Rosengren. Yesterday, after Brainard’s speech, the Dow gained back about 200 points.
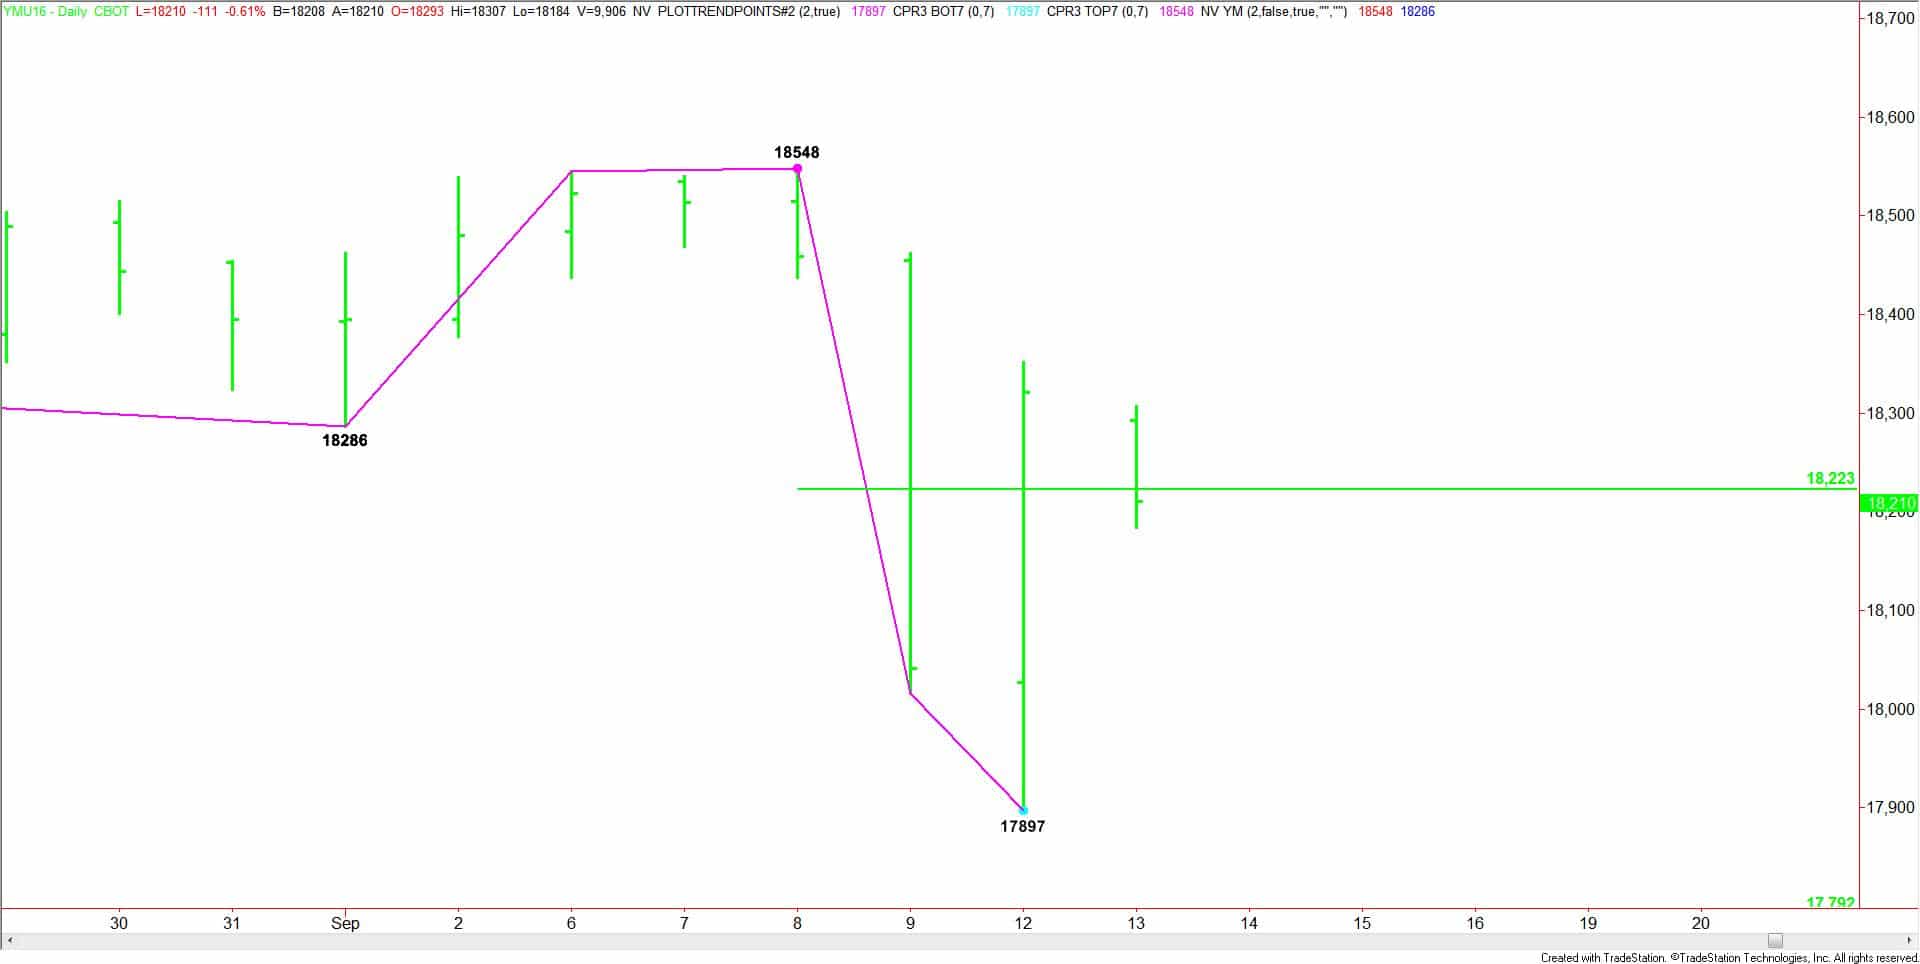
Daily September E-mini Dow Jones Industrial Average

This suggests that investors are going to go into the September 20-21 Fed meeting with an open mind since anything can happen. Even after Brainard’s speech, Atlanta Fed President, Dennis Lockhart, once again sounded the hawkish alarm when he said a “serious discussion” on raising rates was warranted at the central bank’s next meeting.

After Rosengren’s hawkish comments on Friday and Brainard’s dovish comments on Monday, the ‘information’ and ‘misinformation’ as some traders are calling it, have pushed investors into wait-and-see mode. Additionally, on Friday, Fed Funds traders thought the chance of a September rate hike was 30%. Before Brainard’s speech on Monday, the number had dropped to 24%. After the speech, they were down to 20%.
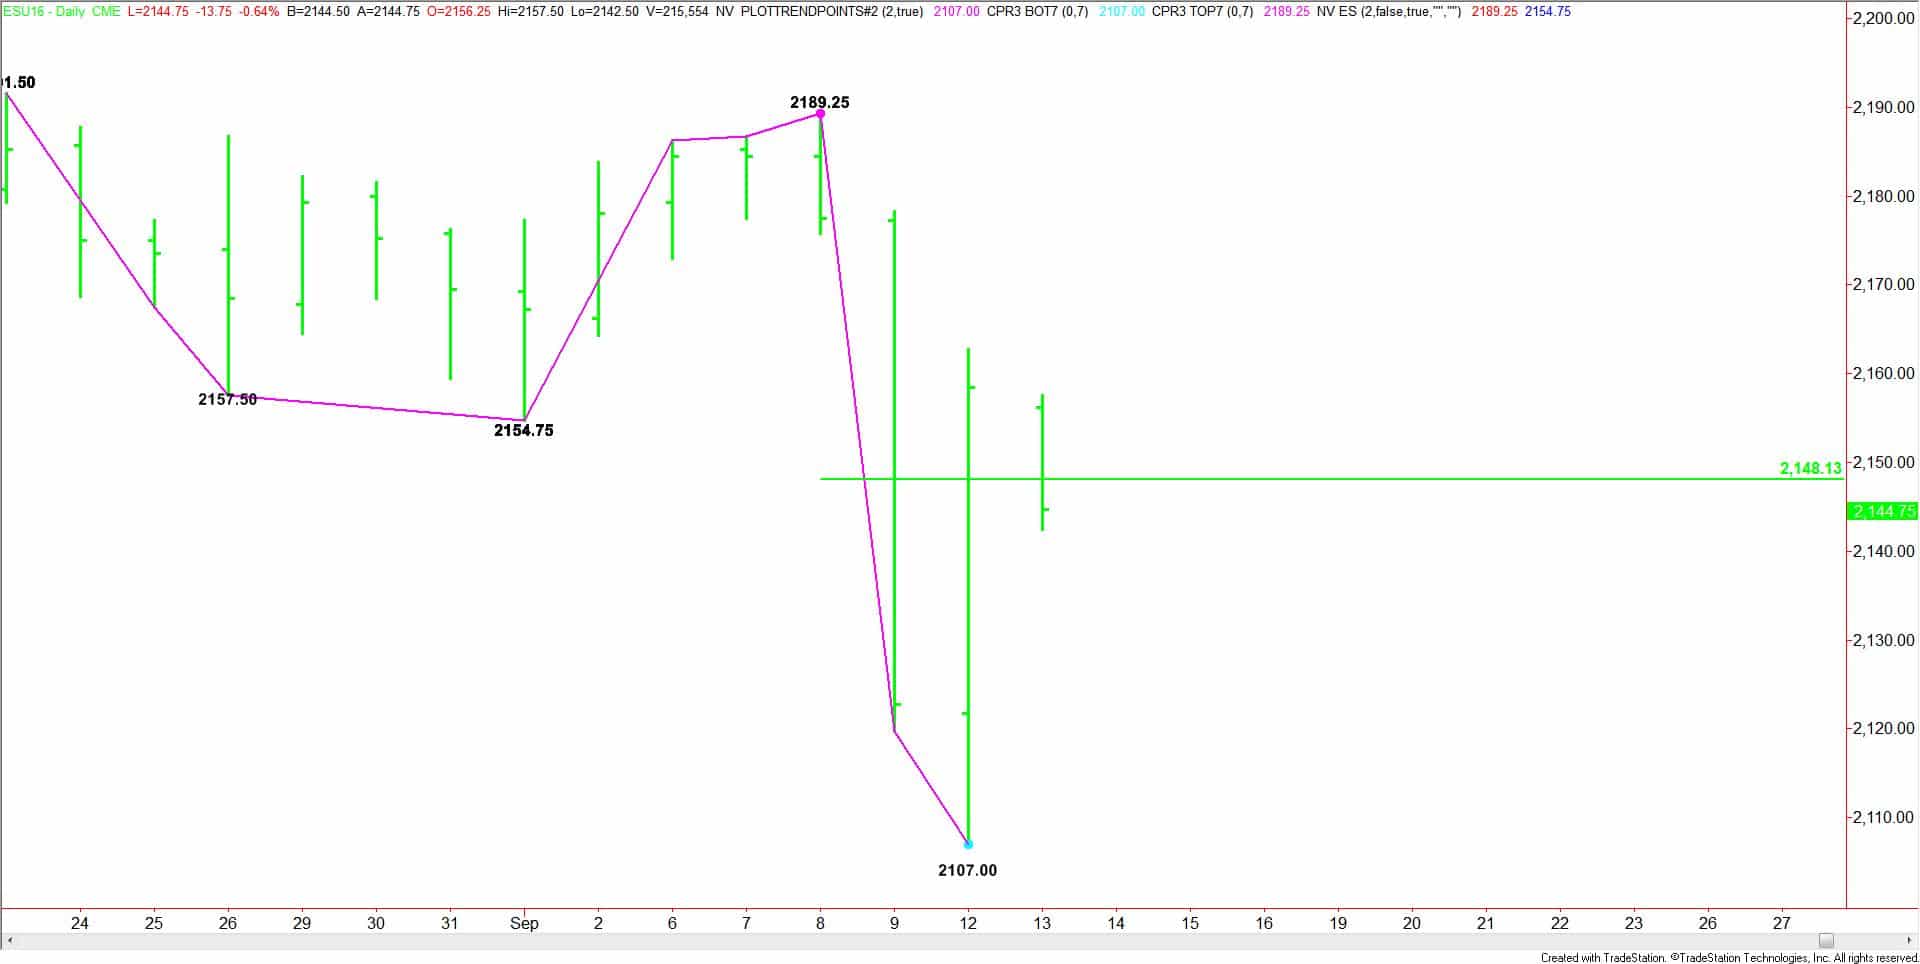
Daily September E-mini S&P 500 Index

Looking at the September E-mini S&P 500 index chart in conjunction with the other data, we see a market straddling a key retracement zone. In other words, Rosengren’s comments were not hawkish enough to sustain the sell-off and Brainard’s dovish comments were not strong enough to start a new rally. Trading at or near the short-term 50% level at 2148.25 is proof of this.

This chart pattern could also be an indication that investors are compromising and saying that rates won’t rise in September, but they are likely to do so in December.

Leading up to the Fed interest rate decision on September 21, I see a sideways stock market with the September E-mini futures contract trading both sides of its short-term 50% level at 2148.25, and the September E-mini futures contract straddling its short-term 50% level at 18223.

Until September 21, it is suggested that you remain flexible and not ask for too much from the market. I don’t expect a breakout move in either direction so it would benefit you to trade both of the 50% levels, playing for short-term moves. Try to avoid buying strength and selling weakness because the volume won’t be there to sustain the moves.

About the Author: James Hyerczyk
James Hyerczyk
  • 40 Articles
  • 8 Followers
James A. Hyerczyk is a financial analyst for FX Empire, a leading financial portal. James has worked as a fundamental and technical financial market analyst since 1982. His technical work features the pattern, price and time analysis techniques of W.D. Gann. James A. Hyerczyk is a senior analyst at FX Empire. He has worked as a fundamental and technical financial market analyst since 1982. His technical work features the pattern, price and time analysis techniques of W.D. Gann.

More from the Author

Retail FX