Things Are Heating Up! What Do the Charts Say Ahead of the ECB Announcement Tomorrow?

Wednesday, 21/01/2015 | 13:28 GMT by Guest Contributors
  • Our new weekly guest blogger, Clive Lambert, explains and analyses the perspective of the charts between the SNB and ECB and readies us for action.
Things Are Heating Up! What Do the Charts Say Ahead of the ECB Announcement Tomorrow?
Clive Lambert

Clive Lambert MSTA MCSI is chief technical analyst at FuturesTechs, a UK-based independent technical analysis company covering Equities , bonds, commodities and Forex . FuturesTechs was established in 2000 and was awarded Independent Research House of the Year at the 2014 Technical Analyst Awards. He is a former LIFFE Floor broker and the author of “Candlestick Charts.” You can connect with him on LinkedIn or Twitter.

We are only a few weeks into 2015 and it’s already shaping up to be a year to remember for the forex markets.

A lot has been written about the Swiss National Bank’s move last week and the fallout from this almost unprecedented move that totally destabilized the markets.

It even prompted me from departing from my usual modus operandi (of just talking about charts) in order to write a blog post on my site espousing my thoughts on what went on. But as I said I am a chart man, so for this first post on Forex Magnates, I’ll stick very much to doing what some say I do well, talking about the charts.

Starting off, tomorrow could well be “massive event number two” for 2015, when it’s widely expected that Mario Draghi will start the engines on full blown QE for Euroland.

So what do the charts say about this? Let’s take a look at a few:

The obvious first stop is EUR/USD. Below is a monthly chart and we can see that the weakness seen in the last nine months has been pretty relentless. In fact, since last May we have posted eight red candles and only one green candle. Obviously, January isn't done yet, but for this month to “turn green” from a candlestick point of view we would need to end the month above the opening price of 1.2100, which could be a big ask--especially since this month has seen a number of really big support levels breached!

Chartists, look left on the chart, back to the last time we were trading at similar levels. Doing this exercise we can see that so far this month we have broken the July 2012 low at 1.2042, the June 2010 low at 1.1876 AND the November 2005 low at 1.1641, taking us down to levels not seen since November 2003 and getting back to the days of Wim Duisenberg (out of respect it appears nobody uses his nickname from that era any more... fair enough).

Chart 1: EUR/USD monthly candlestick chart:
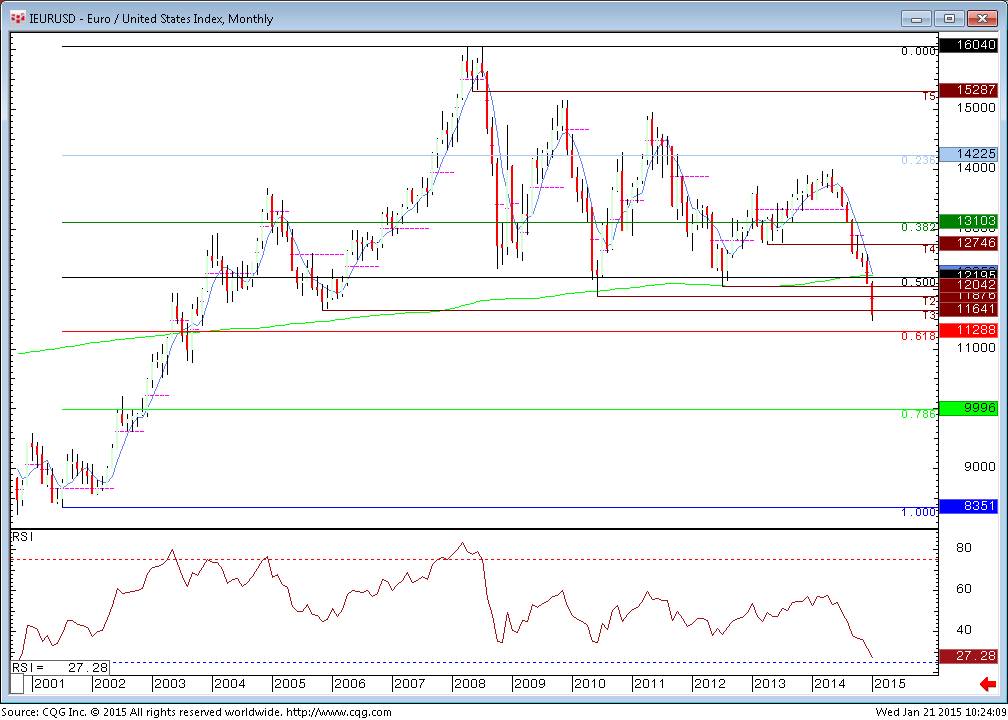
EUR/USD monthly chart

EUR/USD monthly chart

Carrying on this exercise we can identify that the next major support level of note is 1.0765, with 1.1381 something to watch in the meantime. I am also going to watch 1.1288 as this is the 61.8% Fibonacci retracement of the July 2001 – July 2008 rally (a move that took us from 0.8351 to 1.6040).

I can’t help but think that after any initial “knee jerk” move this might turn out to be one of those “buy the rumour, sell the fact” moments or, in this instance, “sell the rumour, buy the fact.” There are a lot of shorts out there and there also seems to be a fairly consistent consensus for what will be seen. In other words, maybe the ECB have been a bit better at managing this than the SNB was.

As far as resistance levels are concerned, what should we watch? I’ve kind of already answered this, because all of the broken supports mentioned above can now be classed as upside levels to watch. I also like 1.1710 as “one to watch” should we see some sort of recovery tomorrow.

So let’s look at a couple of other euro related pairs.

EUR/GBP

Cable also had a rough time in the second half of 2014, so EURGBP spent a good chunk of the latter half of last year chopping about without any firm direction. 2015 has started with a break lower, taking out 7750, which is now a big upside reference. We have used this as our outlet to be short on the euro so far this year, as it’s a slightly “safer” trade than EURUSD. The recent low at 7596 is the lowest print since March 2008 and, looking at the chart going back to then, we find that the next support of note is 7250. Ouch.

Chart 2: EUR/GBP monthly candlestick chart.
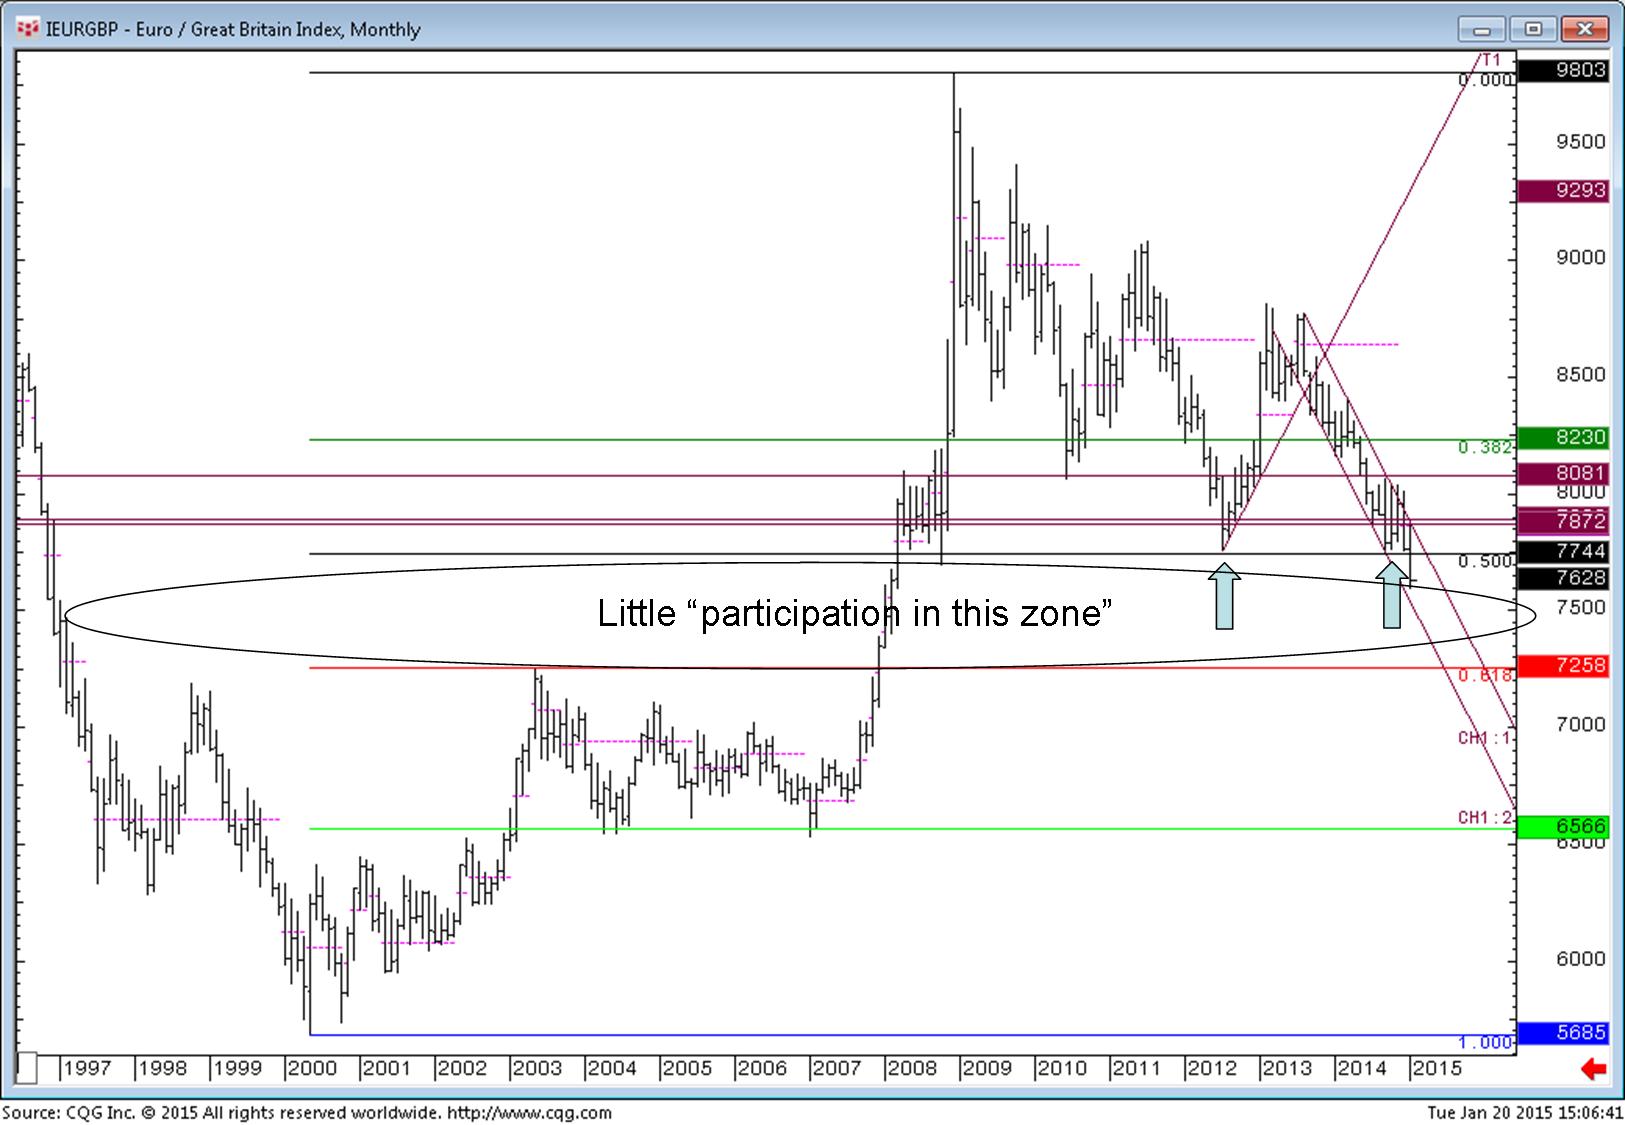
EUR/GBP

EUR/GBP

All of these historical levels also have some relevance when you overlay the Fibonacci “matrix.” 7744 and 7258 are the 50% and 61.8% Fibonacci retracements of the May 2000–December 2008 rally (from 5685 to 9803). This sort of “symmetry” between the price charts and the Fibonacci lines is not unusual but, at the same time, it is extremely compelling. In this case it says we go to 7250 while 7750 is above, and the bear pressure is only alleviated on a move back above 7750.

Lastly, let’s look at EUR/JPY, which has as much to do with the yen story as the euro story. Again, this is a monthly chart and shows we made a new high for this latest move in December, trading up to levels not seen since September 2008, when 1.49-something was a downside trigger level, as it was a big support going back to 2007! See what I mean about “looking left?" The markets have VERY long memories, and charts are there to jog those memories!!

The October low at 134.14 has so far held firm on the swift pullback seen in December and January. This level is very important. 128.50 would be the next target to the downside if it broke. Momentum studies agree with this idea.

Chart 3: EUR/JPY monthly candlestick chart:
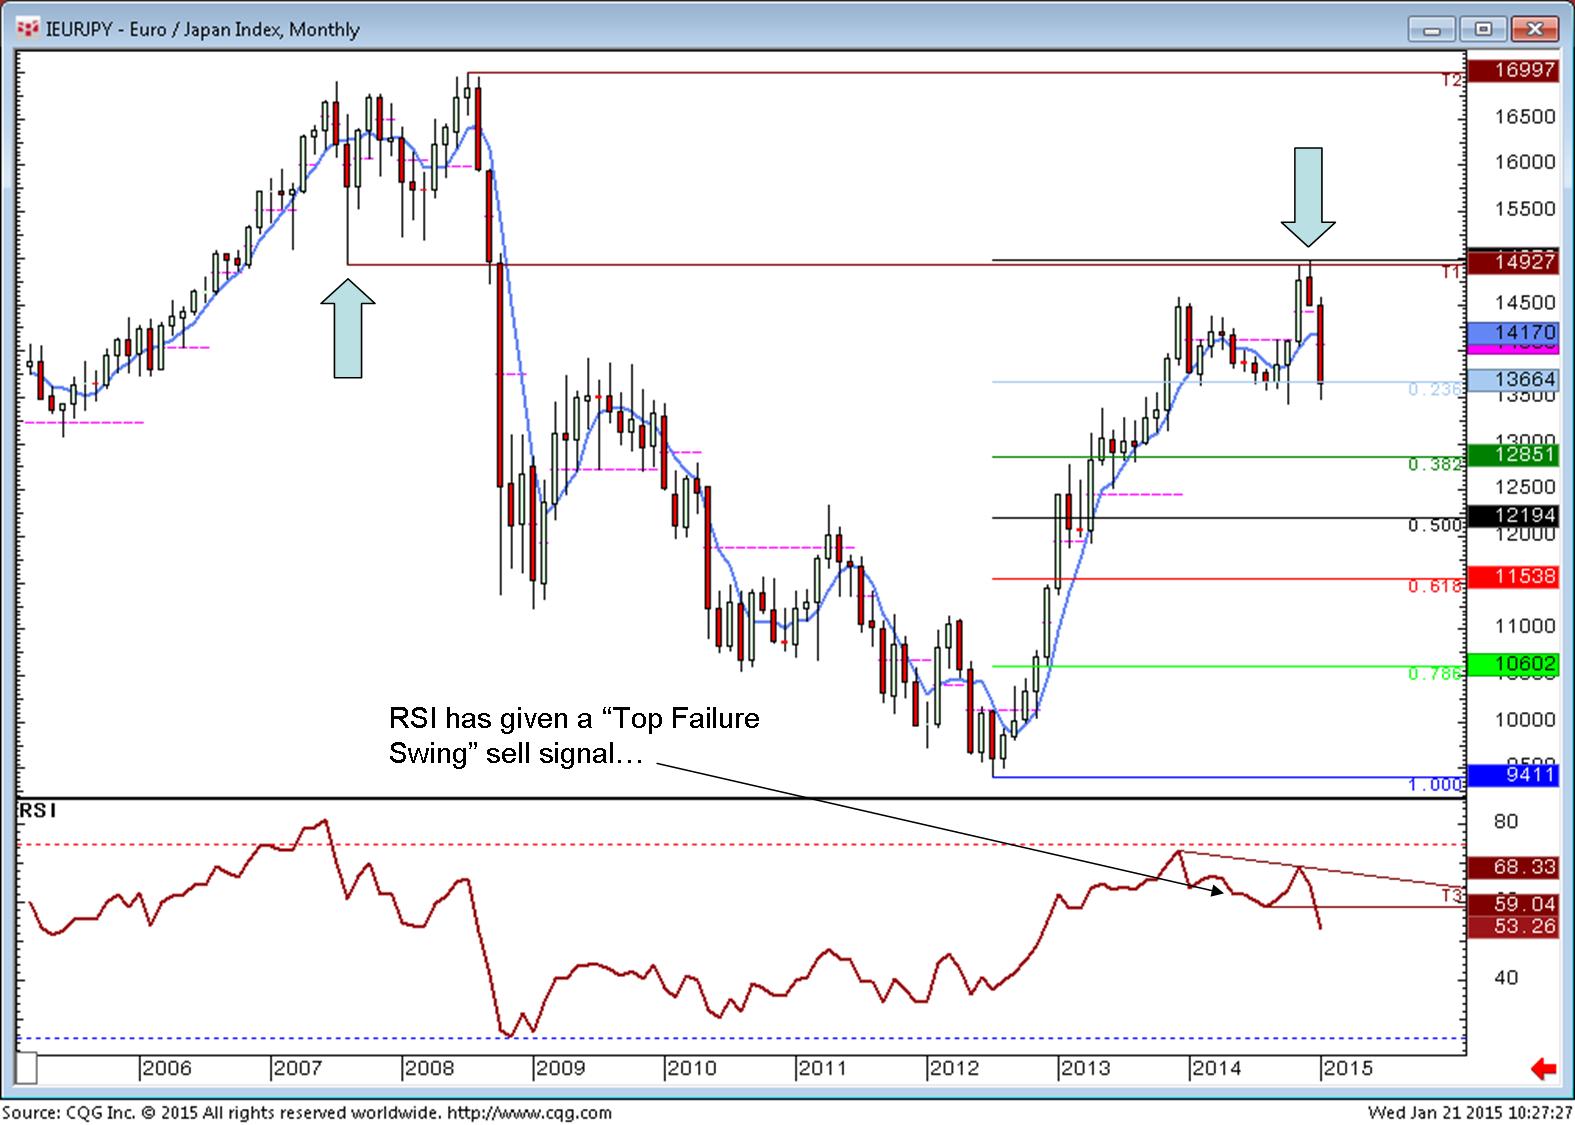
EURJPY_M

Good luck tomorrow. Whatever Mario Draghi throws at us, it could be a doozie, so be ready for action!

This article is part of the Forex Magnates Community project. If you wish to become a guest contributor, please get in touch with our Community Manager and UGC Editor Leah Grantz leahg@forexmagnates.com

About the Author: Guest Contributors
Guest Contributors
  • 410 Articles
  • 9 Followers
This could be your profile next week. Simply apply!

More from the Author

Retail FX