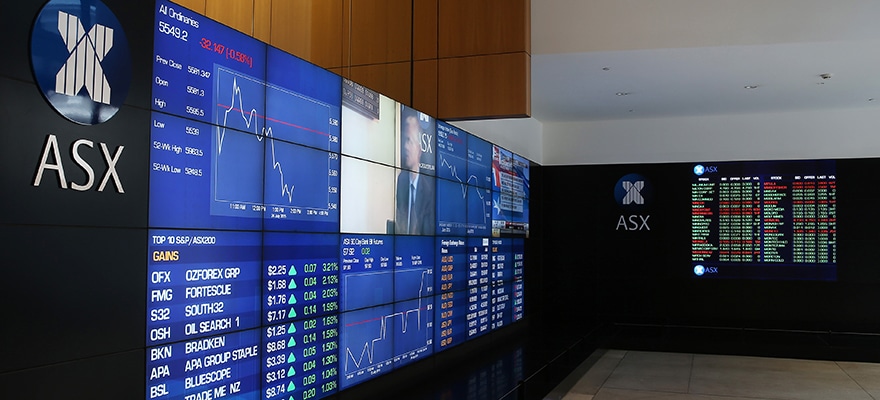
The Australian Securities Exchange (ASX) has just released its monthly activity report for August 2016, which was again characterized by mostly uneven figures – the metrics were reflective of a declining Volatility which permeated the broader global marketplace, according to an ASX statement.
Take the lead from today’s leaders. FM London Summit, 14-15 November, 2016. Register here!
For the month ending August 2016, the value of ASX-listed stocks, as measured by the global All Ordinaries Index, changed marginally to 0.4%, down from 0.5% in July 2016 – the figure also corresponded to a declining expected future volatility reading of 13.2 in August 2016, down from 16.3 in July 2016, suggesting a very tranquil month by way of volatility.
In addition, the ASX’s stock value in August fell -2.0% and was outperformed relative to many other regional exchanges and market blocs, especially when weighed against leaders such as Germany (2.5%), Japan (1.9%), Hong Kong (5.0%), the United States (-0.1%) and Singapore, which fell-1.7% during August 2016.
Metrics Breakdown
Moving to market specifics in August 2016, the ASX also managed to raise $6.2 billion in total capital during the month, which was lower by -27.9% MoM from $8.6 billion in July 2016. However, across its initial capital raise, the exchange also managed to raise $2.51 billion during the month of August 2016 – this did reflect a growth of 76.8% MoM from $1.42 billion in July 2016.
By extension, the total value of cash markets for the ASX during August 2016 was $109.5 billion, down -5.1% YoY from $115.4 billion in August 2015 – in addition to this negative result, the ASX also reported a decline in its average daily value on-market, yielding a figure of $4.1 billion in August 2016, down approximately -14.5% YoY from $4.8 billion in August 2015.
Furthermore, the ASX also disclosed its futures trading statistics during August 2016, yielding a total of 7.7 million futures contracts traded during the month, falling -9.4% MoM from 8.5 million contracts in July 2016. Average daily contracts were however trending higher at 332,967 in July 2016, vs. just 406,090 contracts in July 2015, or -18.0% lower MoM.
Finally, the notional value of over-the-counter (OTC) interest rate derivative contracts centrally cleared during August 2016 was $299.6 billion, against $298.1 billion back in July 2016 – this justified a marginal change of less than 1.0% MoM, though the figure was up a steadfast 149.0% YoY from $120.9 billion in August 2015.


