Cosaic Unveils ChartIQ 8.1’s Options Analytics and Sentiment Tools

Wednesday, 16/12/2020 | 21:44 GMT by Aziz Abdel-Qader
  • The new solution provides an interactive data visualization tool to support options trader and analyst decision-making
Cosaic Unveils ChartIQ 8.1’s Options Analytics and Sentiment Tools
chartiq-options-laptop

US data software provider, Cosaic, formerly known as ChartIQ, released a new visualization solution today that allows banks to improve trading capabilities it offers to their clients.

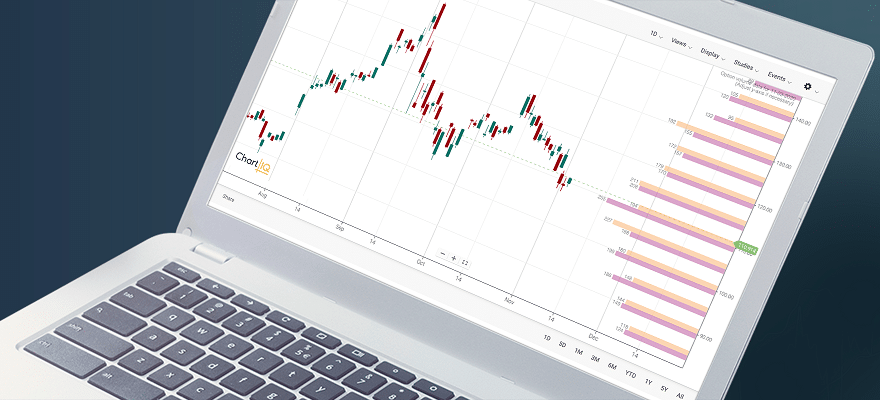
Dubbed ‘ChartIQ Options Analytics ,’ the new solution provides an interactive data visualization tool to support options trader and analyst decision-making. It combines technical analysis with options market data, implied Volatility , open interest and volume data.

Additionally, an options sentiment study is included, which helps traders understand options market sentiment. From a B2B perspective, service providers can get a leg up by providing clients with educational tools around market sentiment.

"As a workflow solutions provider, we're not presenting them with yet another application. We're giving the derivatives trader a real-time graphic solution which complements and enriches their analysis and simplifies the way they work," says Cosaic CEO, Dan Schleifer.

The new additions are part of the release of version 8.1 of ChartIQ visualization platform. It comes a few months after ChartIQ rebranded in order to merge its charting software and smart desktop platform under one brand. The firm’s flagship desktop platform, Finsemble, and charting software, ChartIQ, are now housed under the Cosaic umbrella.

"We provide the graphics infrastructure for banks to create world-class solutions for both their internal teams and direct solutions to their clients who traditionally have had limited access to this type of information," added Chief Product Officer, Eugene Sorenson.

Expanding into B2B Business

ChartIQ provides financial charting and data visualization software to banks, brokerages, financial portals, trading platforms and research analytics providers. The Virginia-based player in the so-called ‘smart desktop’ segment has expanded its product suite for cryptocurrency traders with a crypto-specific analysis and trading toolkit. The product is considered a charting tool but is bundled with many other features to help traders develop and execute their strategies.

Powered by the HTML5 Charting Library, ChartIQ’s market depth chart lets traders get access to live-streamed price, volume and order book data from tens of crypto exchanges in real-time.

For the B2B side, it offers a powerful charting engine that can handle heavy loads of trading data, together with 125+ technical indicators, drawing tools, social sharing and saving capabilities that improve engagement and retention rates for brokerages.

About the Author: Aziz Abdel-Qader
Aziz Abdel-Qader
  • 4984 Articles
  • 31 Followers

More from the Author

Institutional FX