When it comes to smart investing, one of the key elements that plays a crucial role in any successful strategy is the identification of important levels that represent buying or selling pressure, commonly preventing an asset’s price from falling or rising past a certain point. Or technically speaking, working with support and resistance levels.
Levels of asset’s price has difficulty falling below or rising above, known respectively as support and resistance, are an important component of winning tactics designed to help identify important pockets of price action and judge the strength or weakness of momentum in an underlying asset.
Support and resistance, are an important component of winning tactics.
Understanding their function and how to detect them is highly applicable to an entry or exit strategy, helping to better set the risk-reward conditions of any trading game plan.
Support and Resistance: What They Are?
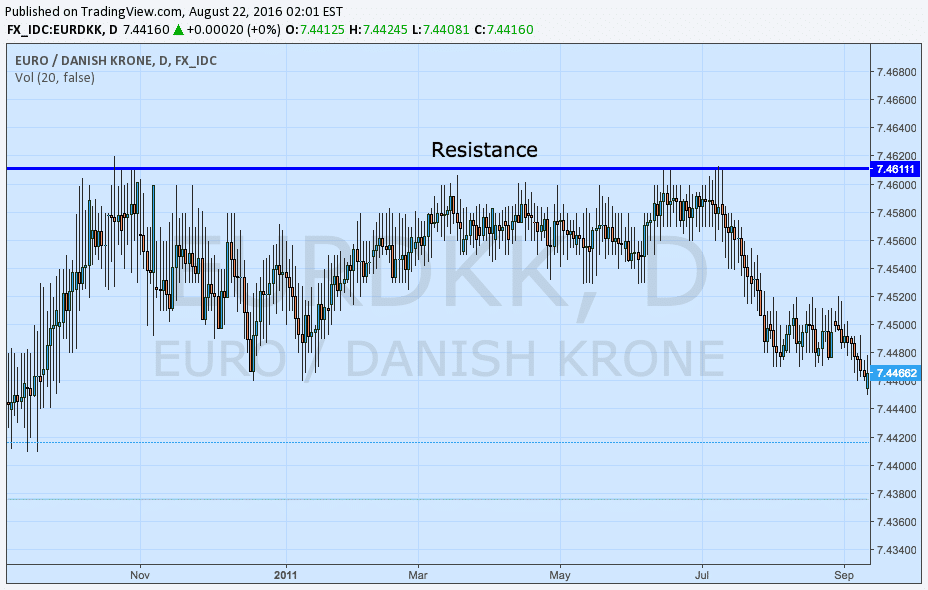
Simply stated, support and resistance can be viewed as price floors and ceilings that an asset is having difficulty overcoming. In the case of a trading instrument that is trending higher over time, resistance would be considered a price level that is challenging upward momentum, often representing a pocket of selling pressure that keeps an asset’s price from rising past a certain point.
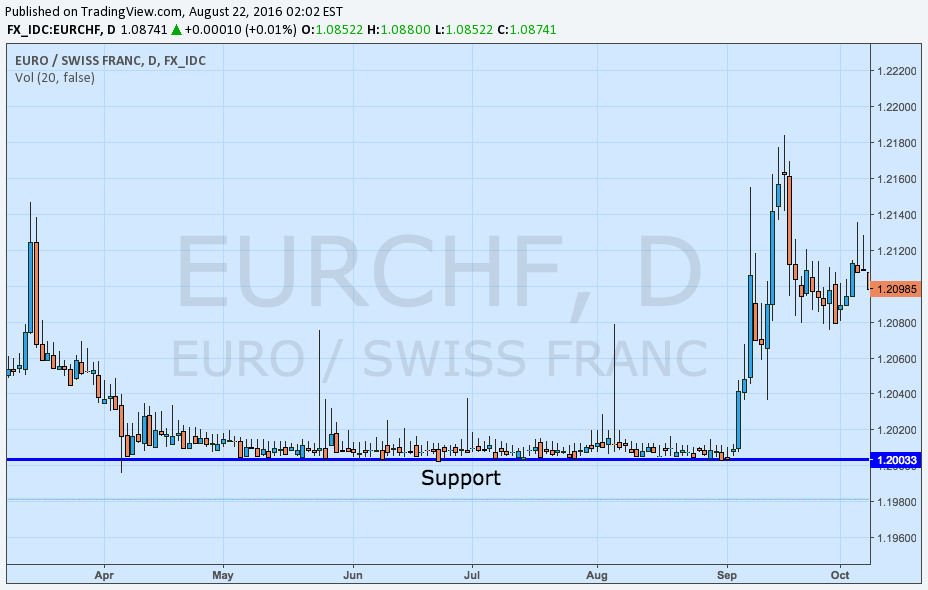
Conversely, for an instrument trending lower time, support would be defined as a price level that prevents asset prices from falling further, acting as a price floor against further declines.
What They Mean
Support and resistance form the basis for understanding important levels that may encounter above average buying and selling pressure that is counter to ongoing directional momentum.
Besides being more broadly defined as historical levels of price action that are accompanied by bullish or bearish turnover activity, support and resistance very clearly represent the interaction of supply and demand. Taken from a more simplistic viewpoint, if supply of an asset outweighs demand, prices of the asset will likely fall.
If supply of an asset outweighs demand, prices of the asset will likely fall.
When demand overtakes available supply, prices of an asset will likely rise. When the forces of supply and demand are equivalent, or reaching an equilibrium point, prices are likely to remain constant have less variability.
Bringing that viewpoint back to trading, it can be said that when an asset’s price is falling, supply, or selling pressure is overtaking buying pressure and vice versa in the case of rising asset prices.
However, once tested two, three, and even four times or more in certain instances, support and resistance represent levels where investors believe an instrument is either overvalued or undervalued to the extent that they are more willing to buy or sell more than normal.
Pockets of support and resistance are considered important because of their ability to halt momentum in its tracks and in some cases send it in the reverse direction. Additionally, these levels may be viewed as points of profit-taking.
How to Identify Support and Resistance
When it comes to actually identifying support and resistance levels there are several different tactics. The main strategy is to look for peaks and valleys, and identify regions where the price action has tested a level but been unable to overcome it without significantly elevated trading turnover.
Typically, a support or resistance level is defined by two to three points of contact without a break of that specific level. Once support or resistance has been identified, it becomes a great way to go ahead and pick potential entry or exit points based on the trading strategy.

If using support or resistance as an entry point, it is helpful in using this same level to determine how much is worthwhile risking for said position. In the event that the support or resistance level of the entry is crossed, it provides a strong signal to exit.
Generally, when using support or resistance to time an exit, it is wise to exit a position before an asset's price hits the level. Around key levels, prices are more likely to encounter increased buying or selling activity which could conceivably prevent the asset from hitting the price level.

Final Notes
If more unfamiliar with identifying support and resistance levels, one easy approach is to find the peak and valley during the time period being examined, connecting the low and high prices with a trend line that forms the basis for the Fibonacci retracements.
Although these are commonly viewed as reversal levels, it is a straightforward way to similarly gauge support and resistance. One final important item to remember about support is that once crossed to the downside it turns into resistance. The opposite also true, with resistance turning into support once crossed.

Idan Levitov
Idan Levtov is the anyoption.com’s VP trading. He is a seasoned professional with years of experience trading and has a vast knowledge of the financial markets. An expert in the binary options hedging field – Idan provides insights, guidance and coordination in business planning, Risk Management and technology strategies.


