Understanding Natural Gas Market. Part II. Demand

Monday, 13/04/2015 | 14:12 GMT by Vladimir Bezruchenko
  • This is the second publication in a series of articles on natural gas market. It explains the demand side of the US market.
Understanding Natural Gas Market. Part II. Demand

As an energy source, natural gas can be used in a variety of ways. It can heat homes and businesses, generate electricity, cook food, drive vehicles or serve as an industrial fuel. It is possible to divide consumers into several categories:

• Population (residential consumption) – private dwellings, apartments.

• Businesses and non-manufacturing activities (commercial consumption) – hotels, restaurants, wholesale and retail stores, etc.

• Industry and manufacturing (industrial consumption) – chemical plants, mining and mineral extraction, etc.

• Power plants (electric power sector) – gas-fired power plants and utility companies in general, whose primary business is to sell electricity and/or heat to the public.

• Transportation (vehicle fuel consumption) – trucks, cars, container ships and other vehicles that run on natural gas.

• Other consumption (technical consumption) – include gas used in drilling operations, as a fuel in natural gas processing plants and gas used in the operation of pipelines.
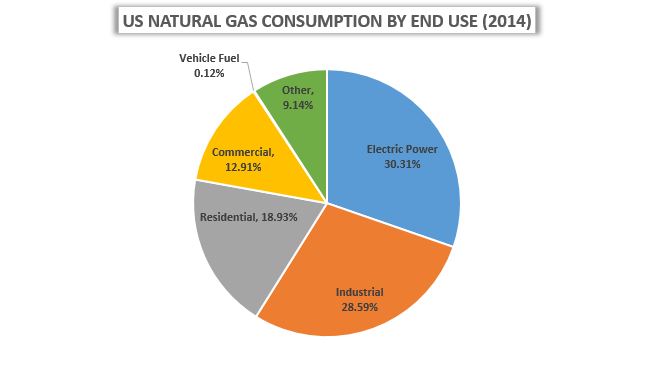
Graph 1_Demand

Source: EIA

A very important characteristic of natural gas consumption is its seasonality. Demand peaks in January because of heavy usage for residential and commercial heating. It then weakens during spring and rises again in the summer months of July and August on electrical generation demand driven by air conditioning use. Demand then cools down again in autumn and starts rising again in winter. Spring and autumn are called “shoulder seasons”. In all three cases the demand for natural gas is driven by weather, which is probably a single most important factor determining natural gas consumption.
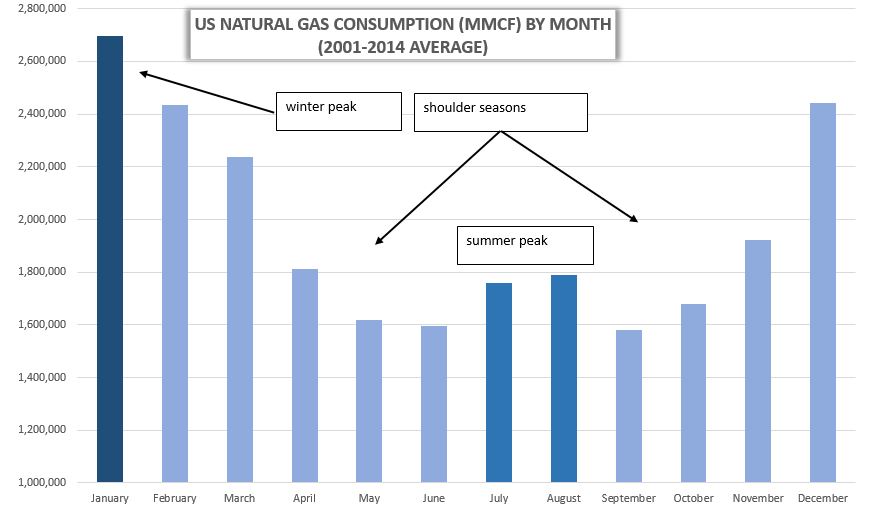
Graph 2_Seasonality

Source: EIA

The seasonality of natural gas consumption is exhibited in the futures curve, where the highest-priced months of January and February are also the two months with the highest demand.
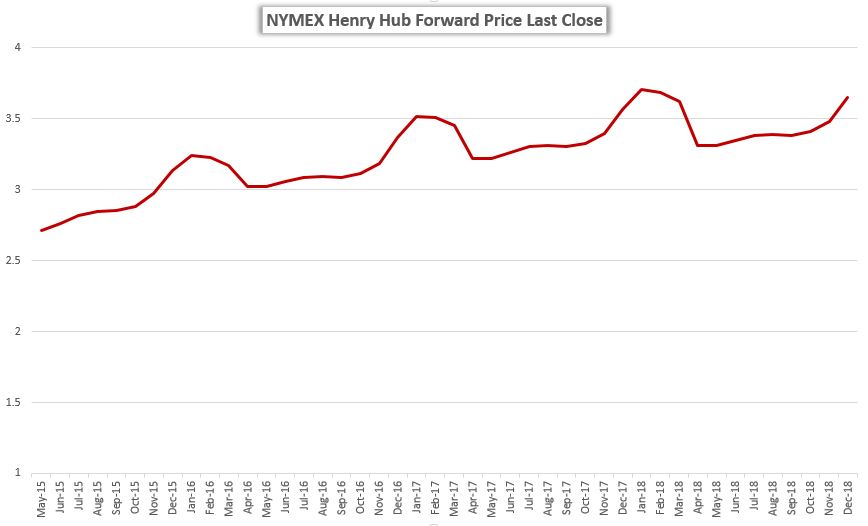
Graph 3_Forward Curve

Source: Thomson Reuters

It is important to note, however, that weather does not drive all of the demand for natural gas (although, it does drive most of it). In fact, roughly a third of consumption has no seasonal pattern. Therefore, one can also divide demand into two broad categories:

1. Volatile, seasonal demand – weather-related demand (residential & commercial consumers and electric power sector) – 62% of total consumption in 2014.

2. Stable, non-seasonal demand – not directly driven by weather (industrial consumers, vehicle fuel, lease, plant fuel, pipeline & distribution use) – 38% of total consumption in 2014. However, one should note that some of the industrial consumption does have a degree of cyclicality, while the amount of gas used for distribution purposes is closely tied to the aggregate consumption and is therefore partly seasonal as well.
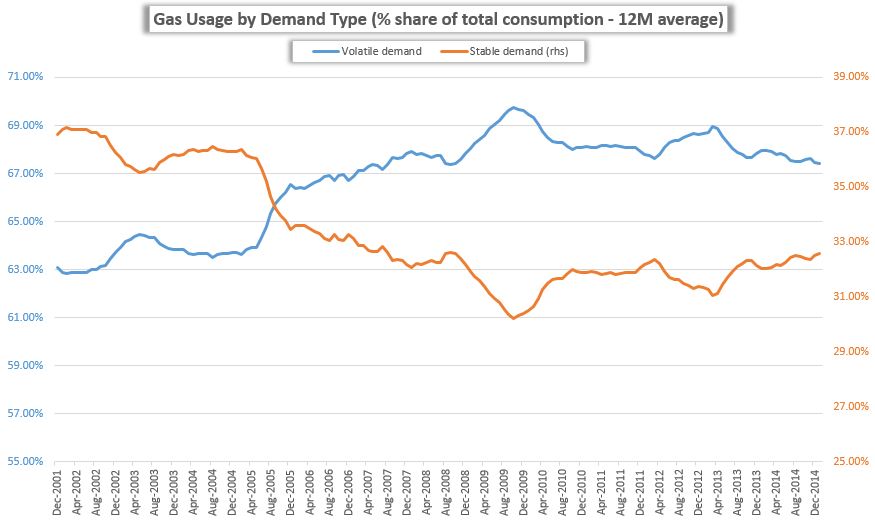
Graph 4_Usage by Type

Source: EIA

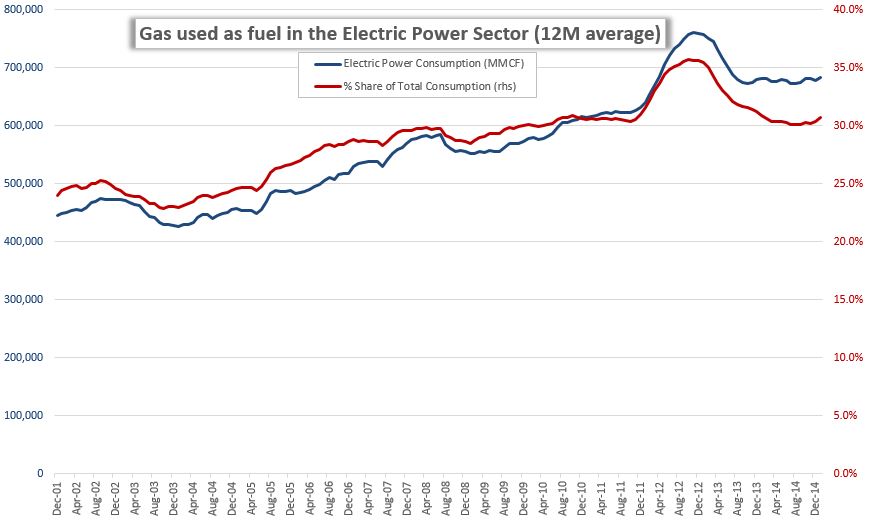
Over the past five years, the share of stable demand has been gradually rising – specifically, due to increased gas consumption in the industrial sector. Natural gas use in electric generation has also grown as the fuel is considered environmentally friendly and has a high heat content.
Graph 5_Electric Power

Source: EIA

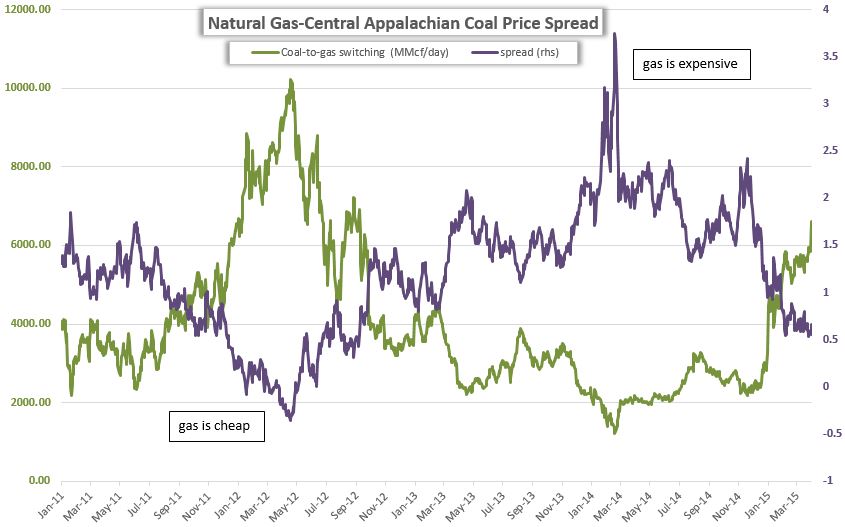
Natural gas is not the only hydrocarbon in the world and is not the only fuel that can be used to generate electricity. There are other substitutes out there and they may have an impact on consumption patterns in different sectors under different market conditions. One sector in which fuel switching occurs most profoundly is electrical generation. There are power plants that can burn both natural gas and coal and utilities may switch between one fuel to another depending on which is more profitable to burn. The spread between two substitute fuels play a key role in driving consumption dynamics. The most obvious substitute of gas in the electric power sector is coal. The graph below shows the spread between natural gas futures and Central Appalachian coal futures. As can be seen from that graph, there is a strong negative correlation between coal-to-gas switching and the spread. Natural gas consumption in the electric power sector rises as gas gets cheaper relative to coal and falls when the opposite occurs.
Graph 6_Spread

Source: Thomson Reuters

However, the cost of fuel is not the only factor determining the economics of fuel switching. Other important factors include: the cost of switching itself (technical cost), taxes, the cost of extra emissions produced by burning a dirtier fuel. In addition, utilities will not switch fuels if it is beneficial for just one day. They will look at the cost of either fuel over a medium to longer time frame to determine which fuel is more beneficial on a BTU basis.

In the next part of our natural gas series, we will take a closer look on the supply side of the market.

Vladimir Bezruchenko is an independent trader based in Kiev, Ukraine. He has been actively trading from home since 2013. He specializes in US natural gas futures (NYMEX Henry Hub ) and high-yielding commodity currencies.

About the Author: Vladimir Bezruchenko
Vladimir Bezruchenko
  • 5 Articles
  • 6 Followers
Vladimir Bezruchenko is an independent trader based in Kiev, Ukraine. He has been actively trading from home since 2013. He specializes in US natural gas futures (NYMEX Henry Hub) and high-yielding commodity currencies. I am independent, retail trader based in Kyiv, Ukraine. After four years in real estate, I made a 360-degree turn in my life and decided to pursue a career in financial markets. I quit my last job in September 2013 and have been actively trading since then. I specialize in US natural gas futures (NYMEX Henry Hub) and high-yielding commodity currencies.

More from the Author

Trading Room